learn
/
methodology
Ad creative analysis: how to find your winning Meta ads, and why they win
Ad creative analysis with AI: break every Meta ad into hook, angle and offer, find which ones win and why, and get a brief to launch. Free Claude skill.
Ad creative analysis with AI: break every Meta ad into hook, angle and offer, find which ones win and why, and get a brief to launch. Free Claude skill.
By Gabriele Franco, co-founder of Cassandra


Get one practical idea every week to grow with the same team
A step-by-step guide to finding your winning ad creatives in the ads you already ran with Claude or Chat GPT. No expensive tool necessary.
Deciding which creative to launch, then hoping it works, is a horrible experience.
Ad creative analysis with AI means letting an agent watch every Meta ad you ran, break each one into its elements, find which elements win and why, and write the brief for your next ad.
In this article
Fixing it usually takes days:
By hand, you export hundreds of ads, tag them, read reviews and write the brief. Days to weeks.
With a creative intelligence tool, plans start around $1,800 and reach $12,000 or more a year.
Either way, a list of winners still leaves you guessing why they won and what to make next.
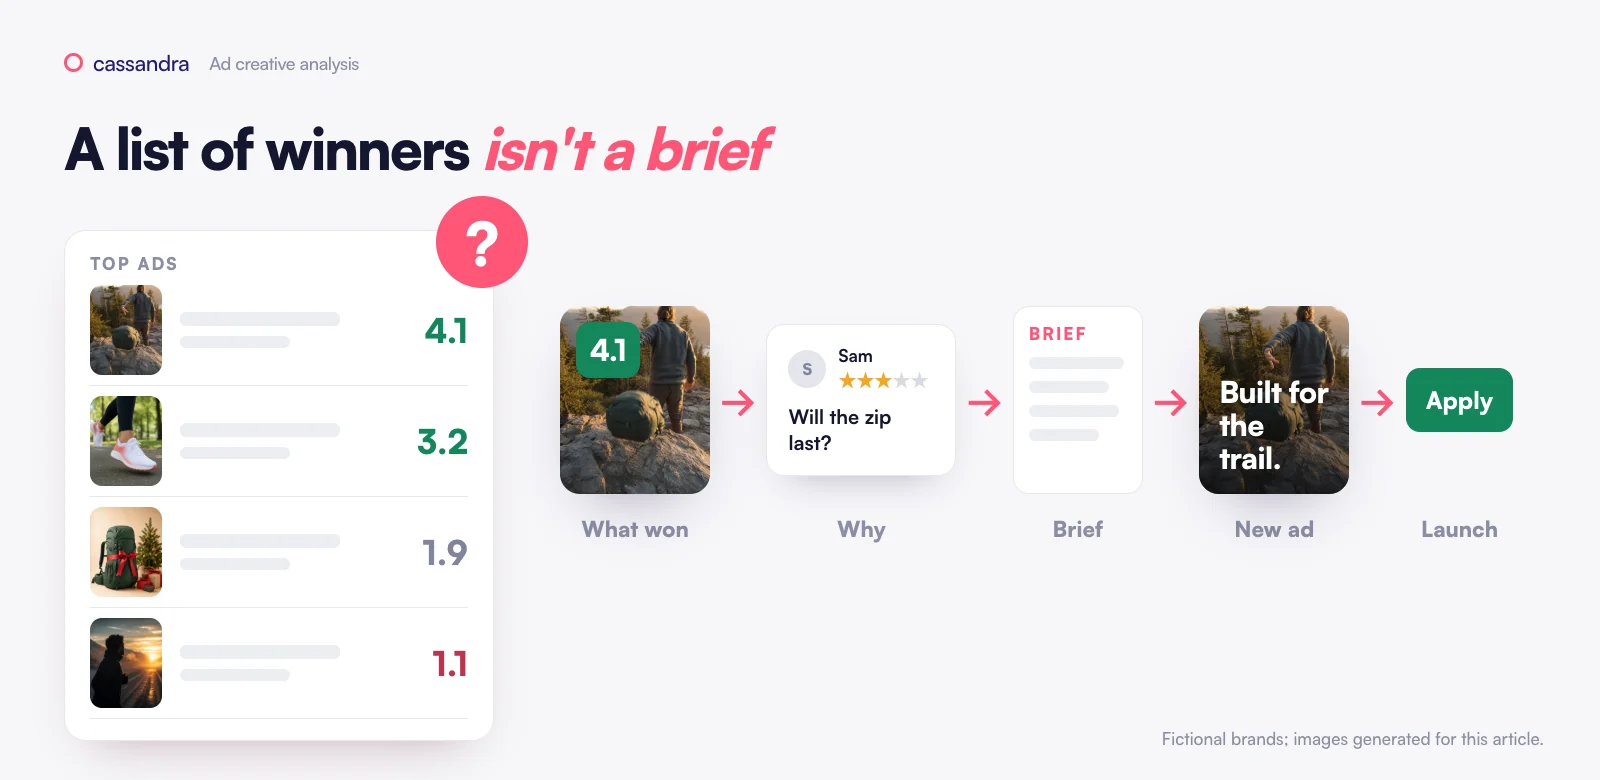
In this article I'll show you how to close the loop: see what works, understand why, and turn it into a brief and a draft ad you can launch. Plus, at the end, a free gift: the Claude skill to do it.
Key findings at a glance
The shows the method shows step by step how to leverage AI tools to scale creative analyses, decisions and implementation by producing an AI workflow that can free our time and keeping effectiveness of our marketing.
What is ad creative analysis?
Ad creative analysis is the practice of tagging every ad by its elements (opening, angle, format, offer, proof) and comparing those elements across hundreds of ads to see which ones go with better results.
Think of your ad account as a lab notebook you never read. Every ad you ran was an experiment you already paid for.
The problem is how we read it. Most teams rank ads by ROAS. But one ROAS has three causes.
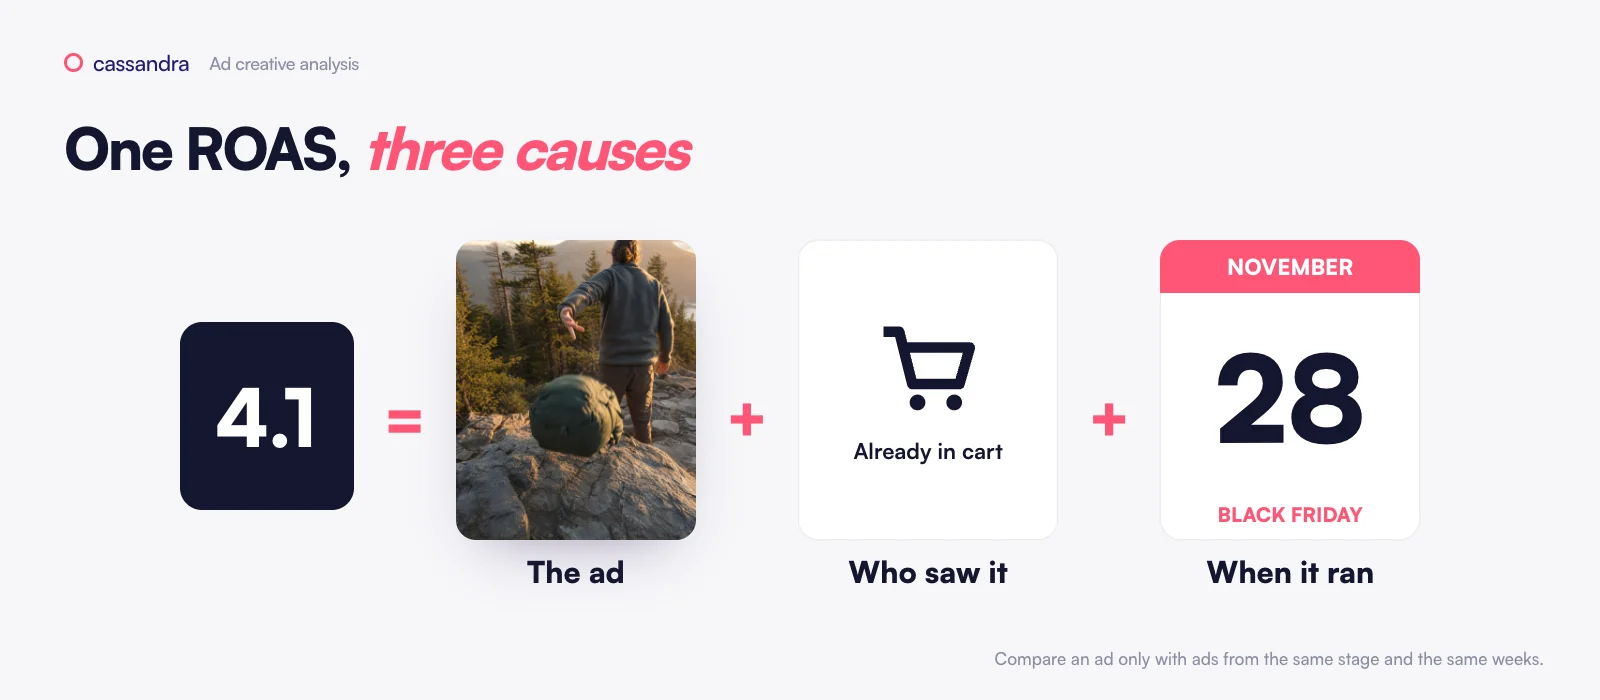
Here's the rule: compare an element only with ads from the same funnel stage and the same weeks.
How do you analyze ad creatives, step by step?
Step 1: Export your ads and their results
The fastest route on Meta is Ads Reporting with the Ad creative breakdown: every row shows the ad's thumbnail next to its numbers, and you can export it.
Open Ads Reporting and pick your ad account.
Create a report for the last 6 to 12 months and add the Ad creative breakdown (under Popular breakdowns). Meta's guide
Add these columns: Ad ID, Ad name, Campaign name, Ad set name, Amount spent, Impressions, Link clicks, CTR (link click-through rate), 3-second video plays, ThruPlays, Purchases, Purchases conversion value, Cost per purchase, Purchase ROAS. Keep one attribution setting, such as 7-day click.
Export as .csv or .xlsx.
No Ad creative breakdown in your account yet? Meta is still rolling it out. Use the Ads tab in Ads Manager with the same columns, then Reports, Export table data. Dynamic creative ads have their own view: Reports, View ad creative performance.
The export gives you names, IDs and thumbnails, not the files. To watch the videos, pull the media with the Marketing API: each ad creative has an image hash or a video ID; use the image's permanent link (the other links are temporary) and the video's source file. A connector like Windsor.ai can pull the same ad-level numbers into Claude.
On Google Ads, the equivalent is the Assets report: open the Performance tab and download it as .csv. Google treats ratios like CTR or ROAS at asset level as directional only.
Then:
Keep the ads that carry 90% of the spend. Often a few hundred out of a few thousand. An ad that spent $12 tells you nothing.
Give each ad a context: funnel stage (from the campaign name), format (video, image, carousel) and period (sale weeks apart from normal weeks).
Step 2: Tag every ad with a vision model
Every ad gets the same fields, each with one value from a fixed list. That's what lets you count a pattern across hundreds of ads.

Which model to use
Job | Model | Why |
|---|---|---|
Tag images and videos | A fast multimodal model, such as Gemini Flash | Reads video directly. About a cent per ad in our runs |
Check the tags | A stronger model, such as Gemini Pro | Plays the second opinion a person would give |
Tag inside Claude or ChatGPT | Claude or GPT | Fine for images. For video, give it frames from the first 3 seconds |
What to tag
Field | Values |
|---|---|
Opening (first frame or 3 seconds) | product first, talking face, problem, bold claim, end result first, question, pattern interrupt |
Angle | functional benefit, emotional benefit, price/value, problem/solution, quality, convenience, identity |
Story | demo, testimonial, before/after, comparison, unboxing, how-to, product showcase |
Product | absent, packshot, in use, demo |
People | none, creator, customer, expert, founder |
Proof | none, star rating, review quote, customer numbers, press |
Offer | none, % off, $ off, free shipping, bundle, gift, limited time |
Look | UGC, lo-fi, studio, motion graphic, meme |
The tagging prompt
You tag paid social ads for a creative-performance analysis.
Brand: <one factual sentence about the brand>.
Media: <image
You tag paid social ads for a creative-performance analysis.
Brand: <one factual sentence about the brand>.
Media: <image
Check the tags before you trust them. Re-tag 30 random ads twice: once with the same model, once with the stronger one. A field passes when the two agree (Cohen's kappa of 0.8 or more for facts like the offer, 0.6 or more for judgement calls like the angle). At least 85% of the fields should pass. A field that fails gets a sharper definition, or leaves the analysis.
Step 3: Link the tags to the results
Each element is judged by the metric it can actually move.

Then compare every ad with its neighbours, not with the whole account.

Index each ad. Its metric divided by the spend-weighted average of the ads in its context. 1.20 means 20% better than the ads it ran next to.
Score each tag value. The spend-weighted average index of the ads that carry it.
Use one attribution setting for every ad, such as 7-day click.
Step 4: Find the patterns, and how sure you are
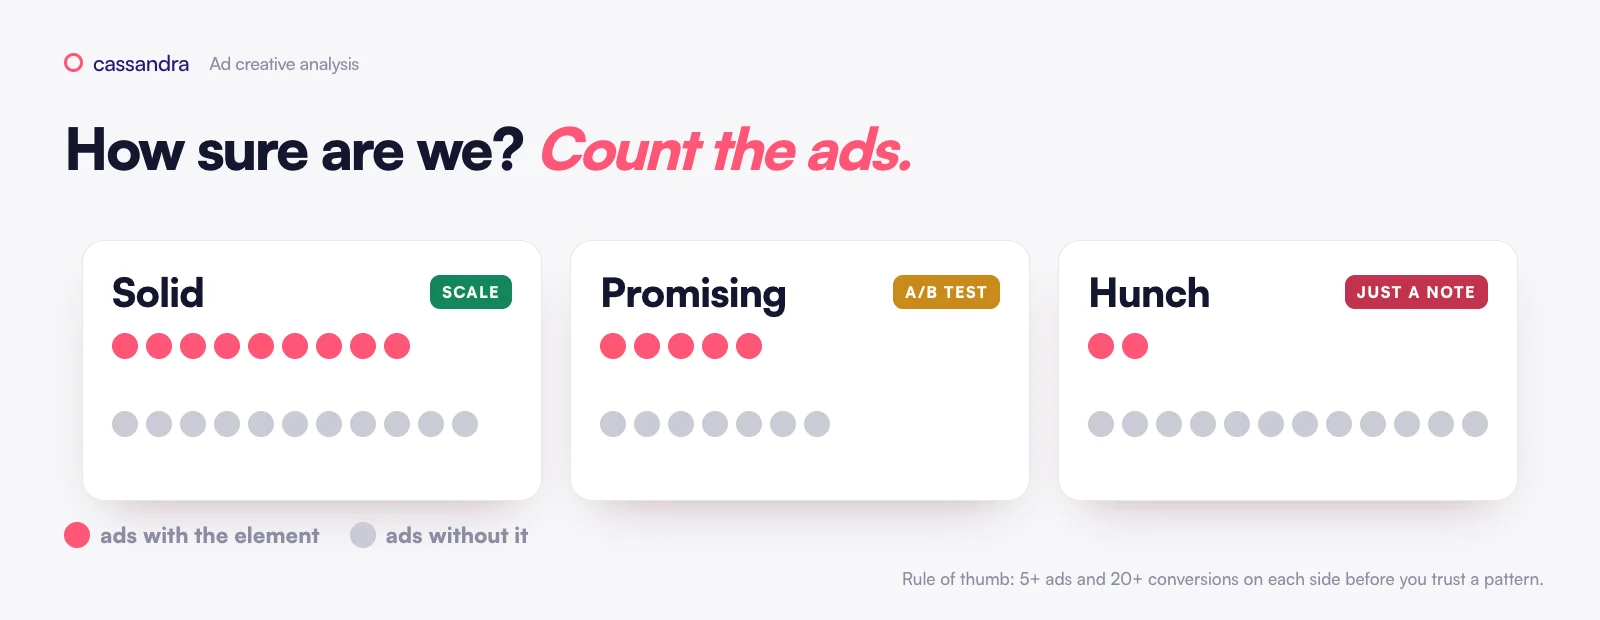
Single elements. A value counts as a signal only with 20 or more ads, and when its 90% interval (resample the ads a few hundred times) stays above or below 1.00. On a small account, never trust fewer than 5 ads and 20 conversions on each side.
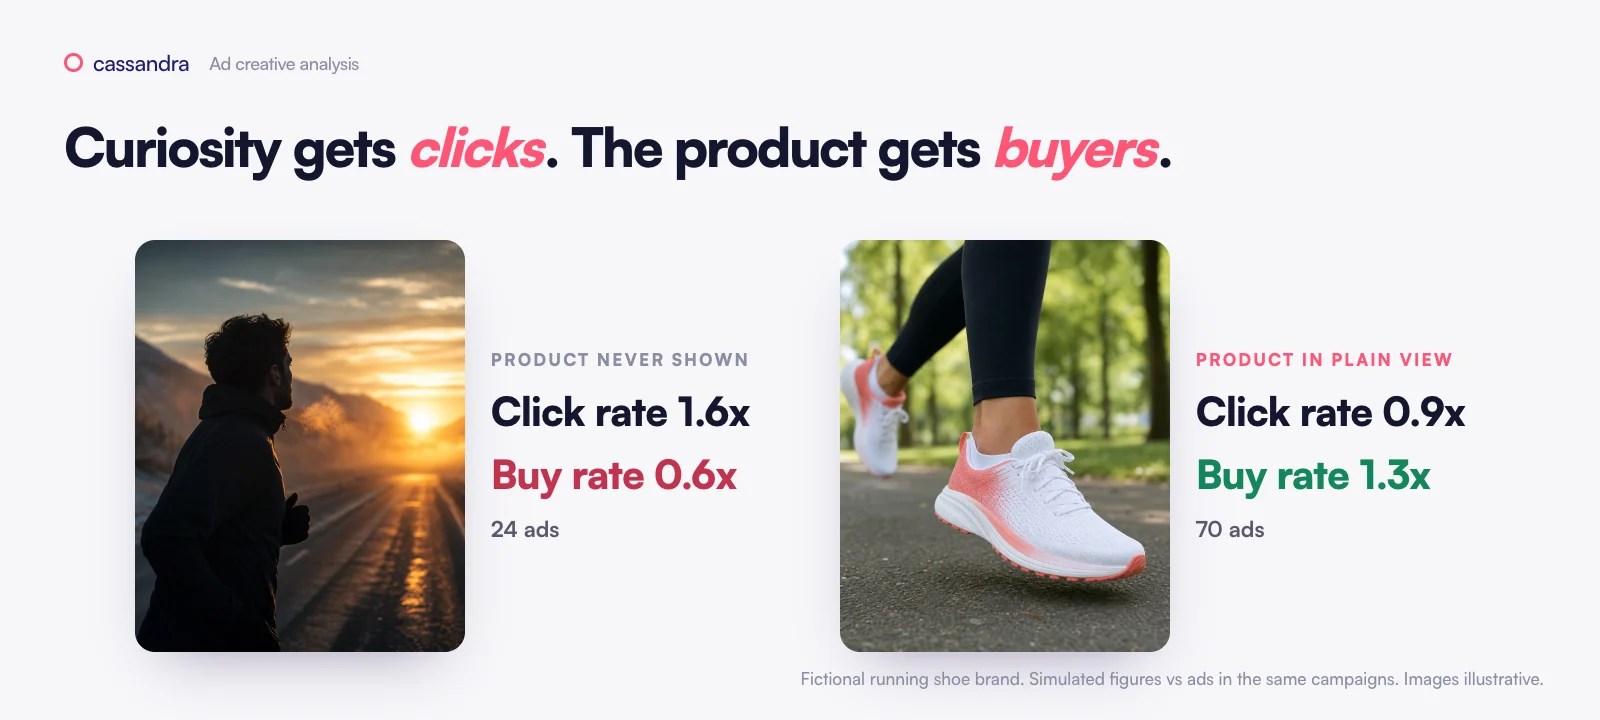
Trade-offs. Look for values that lift CTR but sink the conversion rate. That's curiosity buying clicks.
Pairs. Two values together, such as demo with no offer: 15 or more ads, interval clear of 1.00. Pairs become briefs.
Holdout. Learn the scores on the older 70% of ads, then rank the newer 30%. If your top picks land in the real top quarter more often than 25% of the time (chance), the tags predict. If not, describe, don't recommend.
Confound checks. Re-run without the biggest spender, without sale weeks, and with near-identical variants of one image merged.
Step 5: Ask your customers why
Your ad data tells you what won. It can't tell you why. So the analysis builds a customer map: what buyers want, fear and say, from reviews, forums and your own site, every line with its source. Then it reads your fine print: offer dates, shipping times, warranty terms.
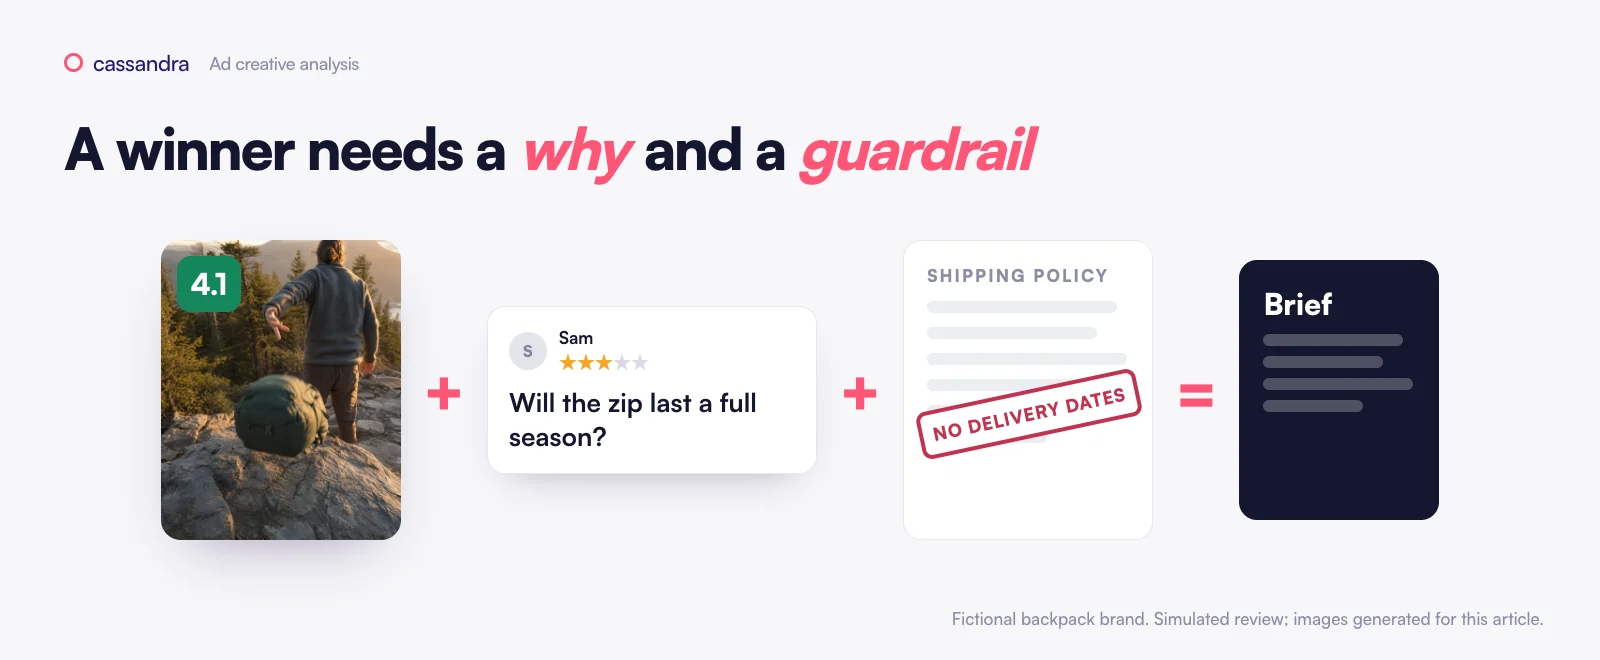
Here's the rule: a guardrail beats a winning pattern.
Step 6: Turn each pattern into a brief
Think of the brief as a recipe, not a mood board.

The logic
One brief per pattern that passed step 4 (15 or more past ads). A customer fear with no ads yet becomes a "test to learn".
Primary metric = the step the pattern works through: hook rate if it changes the opening, conversion rate if it changes the offer, otherwise ROAS.
Claims only from your own live ads and site. Figures that disagree are marked "confirm".
Forecast with a discount. Shrink the pattern's lift by its sample: lift × n ÷ (n + 25).
Test: the new ad against your current best ad, same budget, 2 to 4 weeks, all tests together under about 15% of that campaign's daily spend.
Size it honestly. The smallest lift a test can detect is about e^(2.49 × √(2 ÷ purchases per arm)) − 1: with 100 purchases per arm, roughly 40%. Smaller expected lift means the result is directional, not proof.
The brief prompt
You are a performance creative strategist. Write one ad brief
from the evidence below. Use only these facts.

Pattern: <tag value or pair>, index <x> (90% interval <lo> to <hi>),
<n> ads, <share>% of spend, context <stage>.
Works through: <hook rate | CTR | conversion rate>.
Customer reason: <want or fear>, with 1 or 2 quotes and links.
Allowed claims (from our own ads and site): <list, each with source>.
Never say: <guardrails>.
Reference ads: <IDs and what they show>.
Control (current best ad in this context): <ID
Step 7: Approve, launch, learn
Nothing goes live without you. On Google Ads, Cassandra prepares the change and it goes live when you press Apply. On Meta, you upload the creative. Every brief carries an early check (the funnel step it targets, read after a set spend) and a final check after attribution has landed. If a test misses, the step furthest from its forecast names the cause: hook rate points at the opening, conversion rate at the promise versus the landing page.
What does a full ad creative analysis look like?
Here's one, from start to finish, for the fictional backpack brand.

Not a dashboard of winners and losers: the reason behind them, turned into the next ad.
The running shoe brand gets the same treatment. Its fix: show the shoe, drop the price comparisons, test the wrong-size worry.
Common traps to avoid
The sale-week trap. Discount ads look great because they ran when people were already buying.
The big-spender trap. One ad with half the budget can carry a whole "pattern". Re-run without it.
The click trap. High CTR with no purchases is curiosity, not intent.
The competitor-jab trap. Attacking a rival on a flaw your customers don't report convinces nobody.
Is there a free Claude skill for Meta ads creative analysis?
Yes. We packaged the method as two free skills for Claude and Claude Code: one analyses your ad creatives, one maps what your customers want and fear.

Connect your ad data (with a connector like Windsor.ai or a CSV export), point it at your website, and it tags your ads, finds what wins with the 5-and-20 rule built in, maps what your customers want and fear, and writes 2 to 5 briefs an agent can pick up. It's read-only on your ad account.
Why isn't one ad account enough?
Your ad account is one data point. Good creative decisions also weigh what customers say, what happens after the click, and whether those sales would have happened anyway.
That's why we built Cassandra as a marketing brain: your ad accounts, analytics, sales, customer reviews and incrementality measurement in one place, reasoning together and suggesting what to do next. Start for free.
Key takeaways
Finding your winning ad creatives comes down to three habits: compare elements only with ads from the same stage and weeks, trust a pattern only when the sample backs it, and ask your customers why it wins before you brief it.
The brands that win don't test more ads. They read the ads they already ran.
Prices as shown on each vendor's own pricing page on 28 October 2026, for example Foreplay (Workflow, $149 a month on annual billing, which lists creative analytics on your own ads) and Motion (Starter, $999 a month, which lists creative analytics). The backpack and running shoe brands are fictional: their figures, ads and review quotes are simulated to illustrate the method. Ad images are generated for this article.
A step-by-step guide to finding your winning ad creatives in the ads you already ran with Claude or Chat GPT. No expensive tool necessary.
Deciding which creative to launch, then hoping it works, is a horrible experience.
Ad creative analysis with AI means letting an agent watch every Meta ad you ran, break each one into its elements, find which elements win and why, and write the brief for your next ad.
In this article
Fixing it usually takes days:
By hand, you export hundreds of ads, tag them, read reviews and write the brief. Days to weeks.
With a creative intelligence tool, plans start around $1,800 and reach $12,000 or more a year.
Either way, a list of winners still leaves you guessing why they won and what to make next.
In this article I'll show you how to close the loop: see what works, understand why, and turn it into a brief and a draft ad you can launch. Plus, at the end, a free gift: the Claude skill to do it.
Key findings at a glance
The shows the method shows step by step how to leverage AI tools to scale creative analyses, decisions and implementation by producing an AI workflow that can free our time and keeping effectiveness of our marketing.
What is ad creative analysis?
Ad creative analysis is the practice of tagging every ad by its elements (opening, angle, format, offer, proof) and comparing those elements across hundreds of ads to see which ones go with better results.
Think of your ad account as a lab notebook you never read. Every ad you ran was an experiment you already paid for.
The problem is how we read it. Most teams rank ads by ROAS. But one ROAS has three causes.
Here's the rule: compare an element only with ads from the same funnel stage and the same weeks.
How do you analyze ad creatives, step by step?
Step 1: Export your ads and their results
The fastest route on Meta is Ads Reporting with the Ad creative breakdown: every row shows the ad's thumbnail next to its numbers, and you can export it.
Open Ads Reporting and pick your ad account.
Create a report for the last 6 to 12 months and add the Ad creative breakdown (under Popular breakdowns). Meta's guide
Add these columns: Ad ID, Ad name, Campaign name, Ad set name, Amount spent, Impressions, Link clicks, CTR (link click-through rate), 3-second video plays, ThruPlays, Purchases, Purchases conversion value, Cost per purchase, Purchase ROAS. Keep one attribution setting, such as 7-day click.
Export as .csv or .xlsx.
No Ad creative breakdown in your account yet? Meta is still rolling it out. Use the Ads tab in Ads Manager with the same columns, then Reports, Export table data. Dynamic creative ads have their own view: Reports, View ad creative performance.
The export gives you names, IDs and thumbnails, not the files. To watch the videos, pull the media with the Marketing API: each ad creative has an image hash or a video ID; use the image's permanent link (the other links are temporary) and the video's source file. A connector like Windsor.ai can pull the same ad-level numbers into Claude.
On Google Ads, the equivalent is the Assets report: open the Performance tab and download it as .csv. Google treats ratios like CTR or ROAS at asset level as directional only.
Then:
Keep the ads that carry 90% of the spend. Often a few hundred out of a few thousand. An ad that spent $12 tells you nothing.
Give each ad a context: funnel stage (from the campaign name), format (video, image, carousel) and period (sale weeks apart from normal weeks).
Step 2: Tag every ad with a vision model
Every ad gets the same fields, each with one value from a fixed list. That's what lets you count a pattern across hundreds of ads.
Which model to use
Job | Model | Why |
|---|---|---|
Tag images and videos | A fast multimodal model, such as Gemini Flash | Reads video directly. About a cent per ad in our runs |
Check the tags | A stronger model, such as Gemini Pro | Plays the second opinion a person would give |
Tag inside Claude or ChatGPT | Claude or GPT | Fine for images. For video, give it frames from the first 3 seconds |
What to tag
Field | Values |
|---|---|
Opening (first frame or 3 seconds) | product first, talking face, problem, bold claim, end result first, question, pattern interrupt |
Angle | functional benefit, emotional benefit, price/value, problem/solution, quality, convenience, identity |
Story | demo, testimonial, before/after, comparison, unboxing, how-to, product showcase |
Product | absent, packshot, in use, demo |
People | none, creator, customer, expert, founder |
Proof | none, star rating, review quote, customer numbers, press |
Offer | none, % off, $ off, free shipping, bundle, gift, limited time |
Look | UGC, lo-fi, studio, motion graphic, meme |
The tagging prompt
You tag paid social ads for a creative-performance analysis.
Brand: <one factual sentence about the brand>.
Media: <image
Check the tags before you trust them. Re-tag 30 random ads twice: once with the same model, once with the stronger one. A field passes when the two agree (Cohen's kappa of 0.8 or more for facts like the offer, 0.6 or more for judgement calls like the angle). At least 85% of the fields should pass. A field that fails gets a sharper definition, or leaves the analysis.
Step 3: Link the tags to the results
Each element is judged by the metric it can actually move.
Then compare every ad with its neighbours, not with the whole account.
Index each ad. Its metric divided by the spend-weighted average of the ads in its context. 1.20 means 20% better than the ads it ran next to.
Score each tag value. The spend-weighted average index of the ads that carry it.
Use one attribution setting for every ad, such as 7-day click.
Step 4: Find the patterns, and how sure you are
Single elements. A value counts as a signal only with 20 or more ads, and when its 90% interval (resample the ads a few hundred times) stays above or below 1.00. On a small account, never trust fewer than 5 ads and 20 conversions on each side.
Trade-offs. Look for values that lift CTR but sink the conversion rate. That's curiosity buying clicks.
Pairs. Two values together, such as demo with no offer: 15 or more ads, interval clear of 1.00. Pairs become briefs.
Holdout. Learn the scores on the older 70% of ads, then rank the newer 30%. If your top picks land in the real top quarter more often than 25% of the time (chance), the tags predict. If not, describe, don't recommend.
Confound checks. Re-run without the biggest spender, without sale weeks, and with near-identical variants of one image merged.
Step 5: Ask your customers why
Your ad data tells you what won. It can't tell you why. So the analysis builds a customer map: what buyers want, fear and say, from reviews, forums and your own site, every line with its source. Then it reads your fine print: offer dates, shipping times, warranty terms.
Here's the rule: a guardrail beats a winning pattern.
Step 6: Turn each pattern into a brief
Think of the brief as a recipe, not a mood board.
The logic
One brief per pattern that passed step 4 (15 or more past ads). A customer fear with no ads yet becomes a "test to learn".
Primary metric = the step the pattern works through: hook rate if it changes the opening, conversion rate if it changes the offer, otherwise ROAS.
Claims only from your own live ads and site. Figures that disagree are marked "confirm".
Forecast with a discount. Shrink the pattern's lift by its sample: lift × n ÷ (n + 25).
Test: the new ad against your current best ad, same budget, 2 to 4 weeks, all tests together under about 15% of that campaign's daily spend.
Size it honestly. The smallest lift a test can detect is about e^(2.49 × √(2 ÷ purchases per arm)) − 1: with 100 purchases per arm, roughly 40%. Smaller expected lift means the result is directional, not proof.
The brief prompt
You are a performance creative strategist. Write one ad brief
from the evidence below. Use only these facts.

Pattern: <tag value or pair>, index <x> (90% interval <lo> to <hi>),
<n> ads, <share>% of spend, context <stage>.
Works through: <hook rate | CTR | conversion rate>.
Customer reason: <want or fear>, with 1 or 2 quotes and links.
Allowed claims (from our own ads and site): <list, each with source>.
Never say: <guardrails>.
Reference ads: <IDs and what they show>.
Control (current best ad in this context): <ID
Step 7: Approve, launch, learn
Nothing goes live without you. On Google Ads, Cassandra prepares the change and it goes live when you press Apply. On Meta, you upload the creative. Every brief carries an early check (the funnel step it targets, read after a set spend) and a final check after attribution has landed. If a test misses, the step furthest from its forecast names the cause: hook rate points at the opening, conversion rate at the promise versus the landing page.
What does a full ad creative analysis look like?
Here's one, from start to finish, for the fictional backpack brand.
Not a dashboard of winners and losers: the reason behind them, turned into the next ad.
The running shoe brand gets the same treatment. Its fix: show the shoe, drop the price comparisons, test the wrong-size worry.
Common traps to avoid
The sale-week trap. Discount ads look great because they ran when people were already buying.
The big-spender trap. One ad with half the budget can carry a whole "pattern". Re-run without it.
The click trap. High CTR with no purchases is curiosity, not intent.
The competitor-jab trap. Attacking a rival on a flaw your customers don't report convinces nobody.
Is there a free Claude skill for Meta ads creative analysis?
Yes. We packaged the method as two free skills for Claude and Claude Code: one analyses your ad creatives, one maps what your customers want and fear.
Connect your ad data (with a connector like Windsor.ai or a CSV export), point it at your website, and it tags your ads, finds what wins with the 5-and-20 rule built in, maps what your customers want and fear, and writes 2 to 5 briefs an agent can pick up. It's read-only on your ad account.
Why isn't one ad account enough?
Your ad account is one data point. Good creative decisions also weigh what customers say, what happens after the click, and whether those sales would have happened anyway.
That's why we built Cassandra as a marketing brain: your ad accounts, analytics, sales, customer reviews and incrementality measurement in one place, reasoning together and suggesting what to do next. Start for free.
Key takeaways
Finding your winning ad creatives comes down to three habits: compare elements only with ads from the same stage and weeks, trust a pattern only when the sample backs it, and ask your customers why it wins before you brief it.
The brands that win don't test more ads. They read the ads they already ran.
Prices as shown on each vendor's own pricing page on 28 October 2026, for example Foreplay (Workflow, $149 a month on annual billing, which lists creative analytics on your own ads) and Motion (Starter, $999 a month, which lists creative analytics). The backpack and running shoe brands are fictional: their figures, ads and review quotes are simulated to illustrate the method. Ad images are generated for this article.
Your marketing brain.
Cassandra is the AI marketing brain for growth teams. It learns what drives growth with marketing mix modeling and incrementality tests, then does the work in your ad accounts, within your rules.
Product
Company
Copyright © 2026 – All Rights Reserved
Your marketing brain.
Cassandra is the AI marketing brain for growth teams. It learns what drives growth with marketing mix modeling and incrementality tests, then does the work in your ad accounts, within your rules.
Product
Company
Copyright © 2026 – All Rights Reserved