blog
/
research
2026 Media Effectiveness Benchmarks: Risk-Adjusted ROI Across 83 Channels and $1.85B in Ad Spend
2026 media effectiveness benchmarks: ROI, risk, and confidence intervals across 83 channels and $1.85B in measured ad spend. Built on 1,221 MMMs.


Get a weekly dose of insightful people strategy content
Executive Summary
We studied 1,221 revenue Marketing Mix Models (MMMs) across 123 brands, 22 markets, 83 advertising channels, and $1.85B in measured marketing spend (2020-2025). The goal is simple: help marketers compare channels using Risk-Adjusted ROI, which balances expected returns with uncertainty for more realistic media planning and budget allocation.
Instead of treating ROI as a single-point truth, we evaluate how predictable each channel's outcome tends to be. This matters because two channels tend show comparable median ROI, yet one may vary wildly, making it harder to forecast and to scale effectively.
Key Findings at a Glance
Google and Meta Lead for Performance and Predictability: In many media plans, this combination makes them strong "foundation" channels - reliable enough to scale while still delivering meaningful return on investment. Google shows ~4.4x median ROI with confidence interval width of 1.9, while Meta shows ~2.9x median ROI with confidence interval width of 1.7. TikTok shows ~2.2x median ROI with confidence interval width of 1.7 across 56 clients. Confidence intervals are 90% bootstrap (5th–95th percentile across clients).
Risk-Adjusting Reshapes Rankings: Some channels show high median ROI but drop significantly after risk adjustment when outcomes are highly variable. This doesn't automatically mean a channel is "bad" - it often means it's more execution-dependent and benefits from stronger creative testing, measurement discipline, and operational maturity.
Portfolio Strategy Matters: Rather than picking winners in isolation, this research groups channels into a practical allocation framework: Foundation (more predictable, scalable), Growth (scalable but needs repeated and rigourous testing), and Innovation (higher variance, higher upside, requires experimentation).
Bottom line: The best media mix isn't just the highest ROI on paper - it's the mix that balances return, uncertainty, and your ability to execute.
Table of Contents
- Executive Summary
- What is Risk-Adjusted ROI?
- Introduction: Why Media Effectiveness Benchmarks Matter
- Marketing Channel Performance: Scale vs. Efficiency
- How Uncertainty Changes the ROI Picture
- Risk-Adjusted ROI Rankings
- Portfolio Framework: Foundation / Growth / Innovation
- Methodology & Data Behind the Benchmarks
- Known Limitations
- Frequently Asked Questions (FAQ)
What is Risk-Adjusted ROI?
Risk-Adjusted ROI is a marketing analytics metric that adjusts median ROI by uncertainty to reflect how predictable a channel's outcomes are. This approach helps marketers make more informed budget allocation decisions by accounting for both expected returns and the variability of those returns.
Formula:
Risk-Adjusted ROI = Median ROI / (1 + Confidence Interval Width)
A narrow confidence interval indicates a more precise estimate and more consistent performance across different brands, budgets, creatives, and execution conditions. A wide confidence interval suggests outcomes vary significantly, which increases planning risk and requires more sophisticated testing and optimization capabilities.
Important Disclaimer: Benchmarks are directional guides, not guarantees. Always validate findings with your own measurement program including controlled experiments, incrementality testing, or updated Marketing Mix Modeling specific to your business context.
Introduction: Why Media Effectiveness Benchmarks Matter
Foreword by Gabriele Franco, CEO at Cassandra.
Emarketer and Statista projected the global advertising industry would surpass, for the first time in history, US$1 trillion in 2025. This is approximately the size of the consumer investment finance industry (financial products and services provided to households for saving, borrowing, and investing), at US$1.2 trillion in 2023 and growing approximately 6.9% year over year.
An investment industry living in a world with opaque information and no warning or explanation about the risks undertaken would not exist. Imagine a world with little access to third-party independent brokers or advisors. You would not trust this world with your hard-earned cash.
The advertising industry is ingrained in unproven beliefs, falsehoods, and easy narratives built on shaky grounds. Under the pretense that "it's just advertising," the industry forgoes scientific rigor and works with antiquated tools and very shallow scientific knowledge. Businesses of all sizes rely mainly on what ad platforms are telling them about how their investment is performing.
Google, Meta, and Amazon are advertising behemoths, and they do provide value to thousands of businesses. The questions are twofold: How much value? And is your advertising spend allocation optimal for your business and your risk appetite?
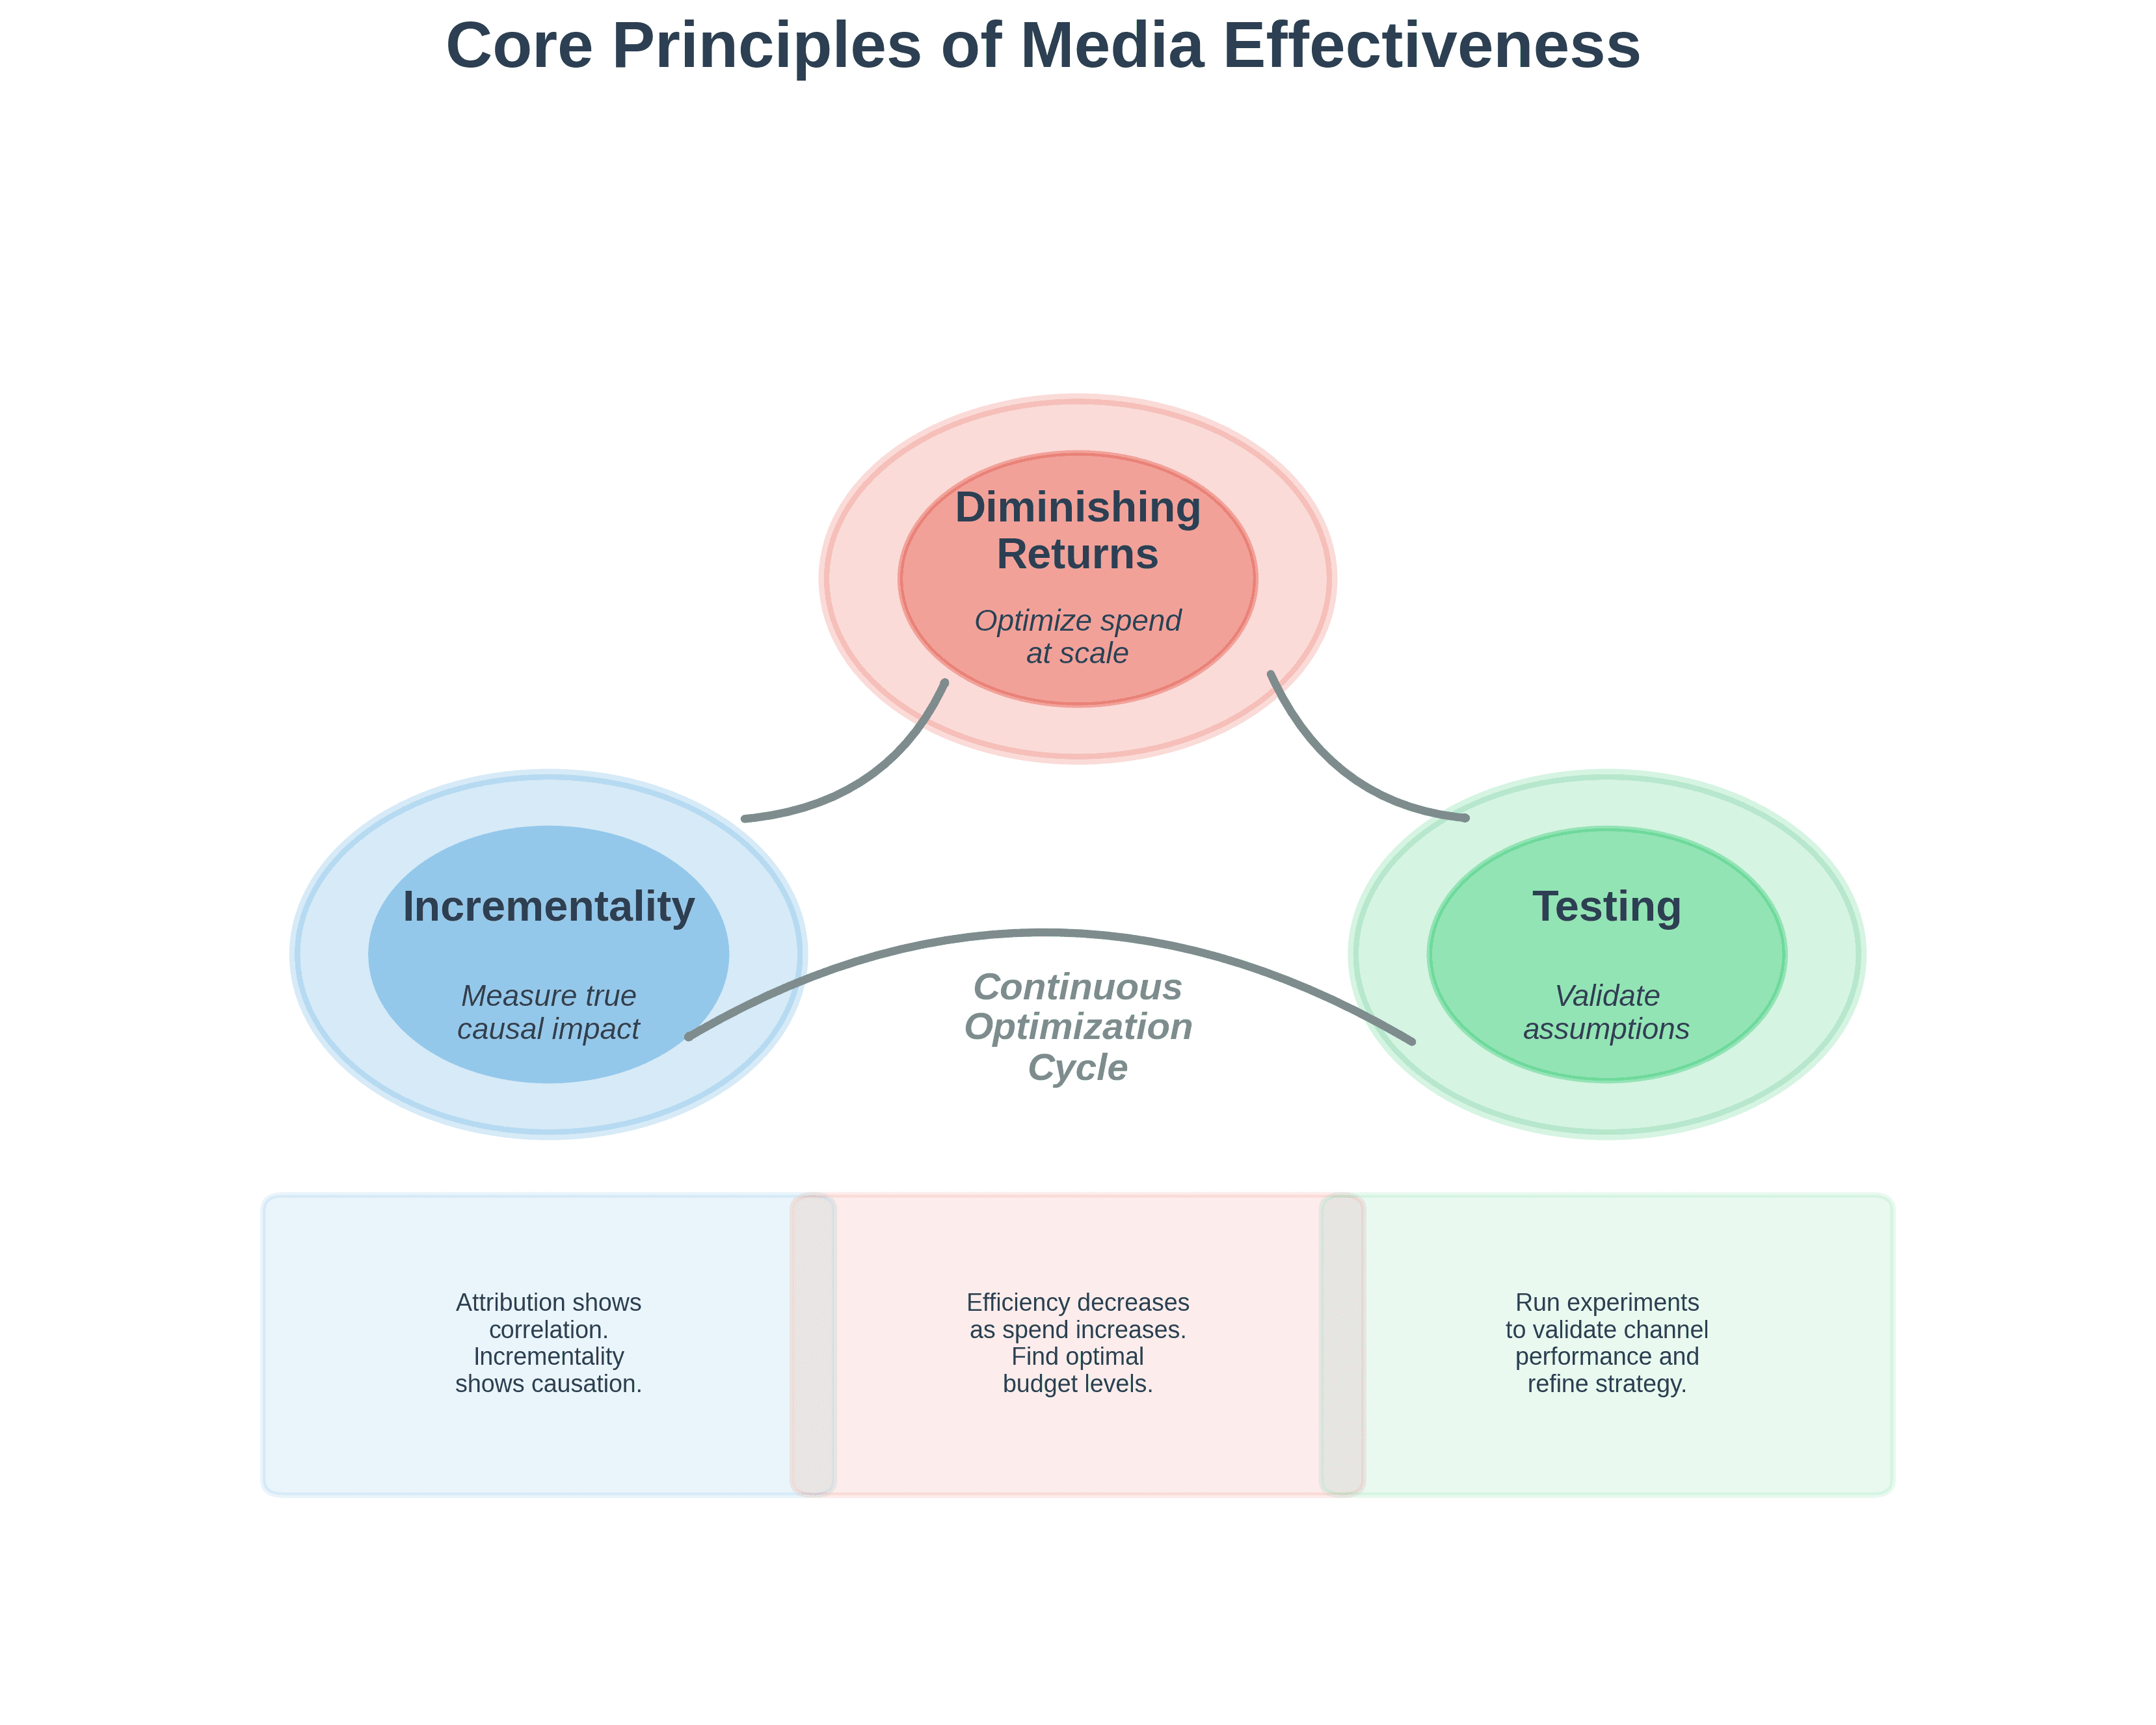
Three Core Principles of Marketing Effectiveness
1. Incrementality
Brands are starting to understand that not every dollar of advertising investment is incremental. In other words, for most businesses, if you stop advertising completely, your sales do not go down to zero. You still sell, although very likely, you'll sell less. Knowing with precision how much incremental sales or orders an advertising channel brings is what your CFO wants to know. The value of your business is directly linked to how much incremental revenue you can add to the top line.
2. Diminishing Returns
Whether you invest $5,000/month or $1M/month in the same advertising channel, what you can expect in return may be drastically different. The return on investment varies significantly based on investment levels and the time of year. Advertising saturates more or less quickly: Your next dollar invested above $5,000 or above $1M may get your business a very different marginal return. That same amount might also yield very different returns during peak season like Black Friday week versus the middle of January. The temporality of this relationship is key to maximizing return.
3. Testing
One of the most powerful advantages of digital marketing channels is their ability to iterate quickly and cost-effectively. You can start and stop whenever you want. You can invest from $1 to millions of dollars per week. You can geo-target specific regions and iterate across dozens of targeting, creative, and settings features. Traditional channels like TV or radio cannot match this level of agility. Yet, not enough brands are testing or even trying to test whether their digital investment works for them.
Cassandra's Vision for 2026
Cassandra's mission is seeking the truth at all costs, building a cost-effective decision tool for marketers of all sizes. In 2026, we believe the following will become reality at Cassandra and of utmost importance for the advertising industry:
Risk/Reward Portfolio Management
Most businesses invest in multiple advertising channels or mechanisms (social ads, paid search, TV, email marketing, sponsorships). Every business should manage these investments like a portfolio. At Cassandra, we aim to provide continuous understanding of the risk level behind portfolio decisions. If you change your media mix with Option A, the expected return is high but the risks of not reaching your objectives are high too. Option B is more conservative in expected return but also more certain. We ask: What is your risk appetite, and we'll organize your portfolio accordingly.
Forecast vs. Reality Validation
Any media allocation tool should be judged on results forecasted AND landed. It's not enough to recommend - it's necessary to forecast 3-month-out returns and be judged on actual results. We're building the most sophisticated forecasting tool in the industry. Understanding with precision huge seasonality peaks like Black Friday, is equally important 2 weeks out and 3 months out. Knowing precisely the points of diminishing returns over time**, means money for most brands**.
Simplified Testing
Testing with scientific rigor is still too complicated or time-consuming for most businesses. The promise of digital platform agility is not fully realized for most marketers. We will make testing as easy as clicking a button in 2026.
Disclaimer: This is not investment advice. No part of this content should be construed as such. You should consult with a qualified Marketing Analytics advisor tailored to your particular advertising investment portfolio.
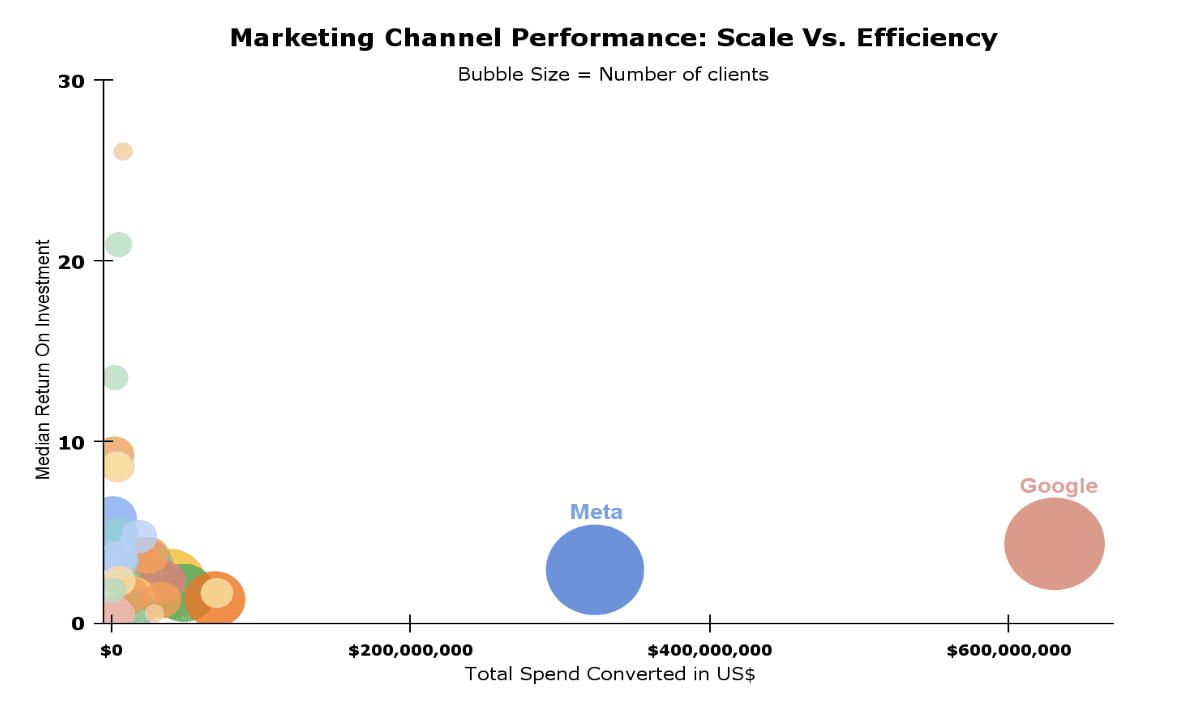
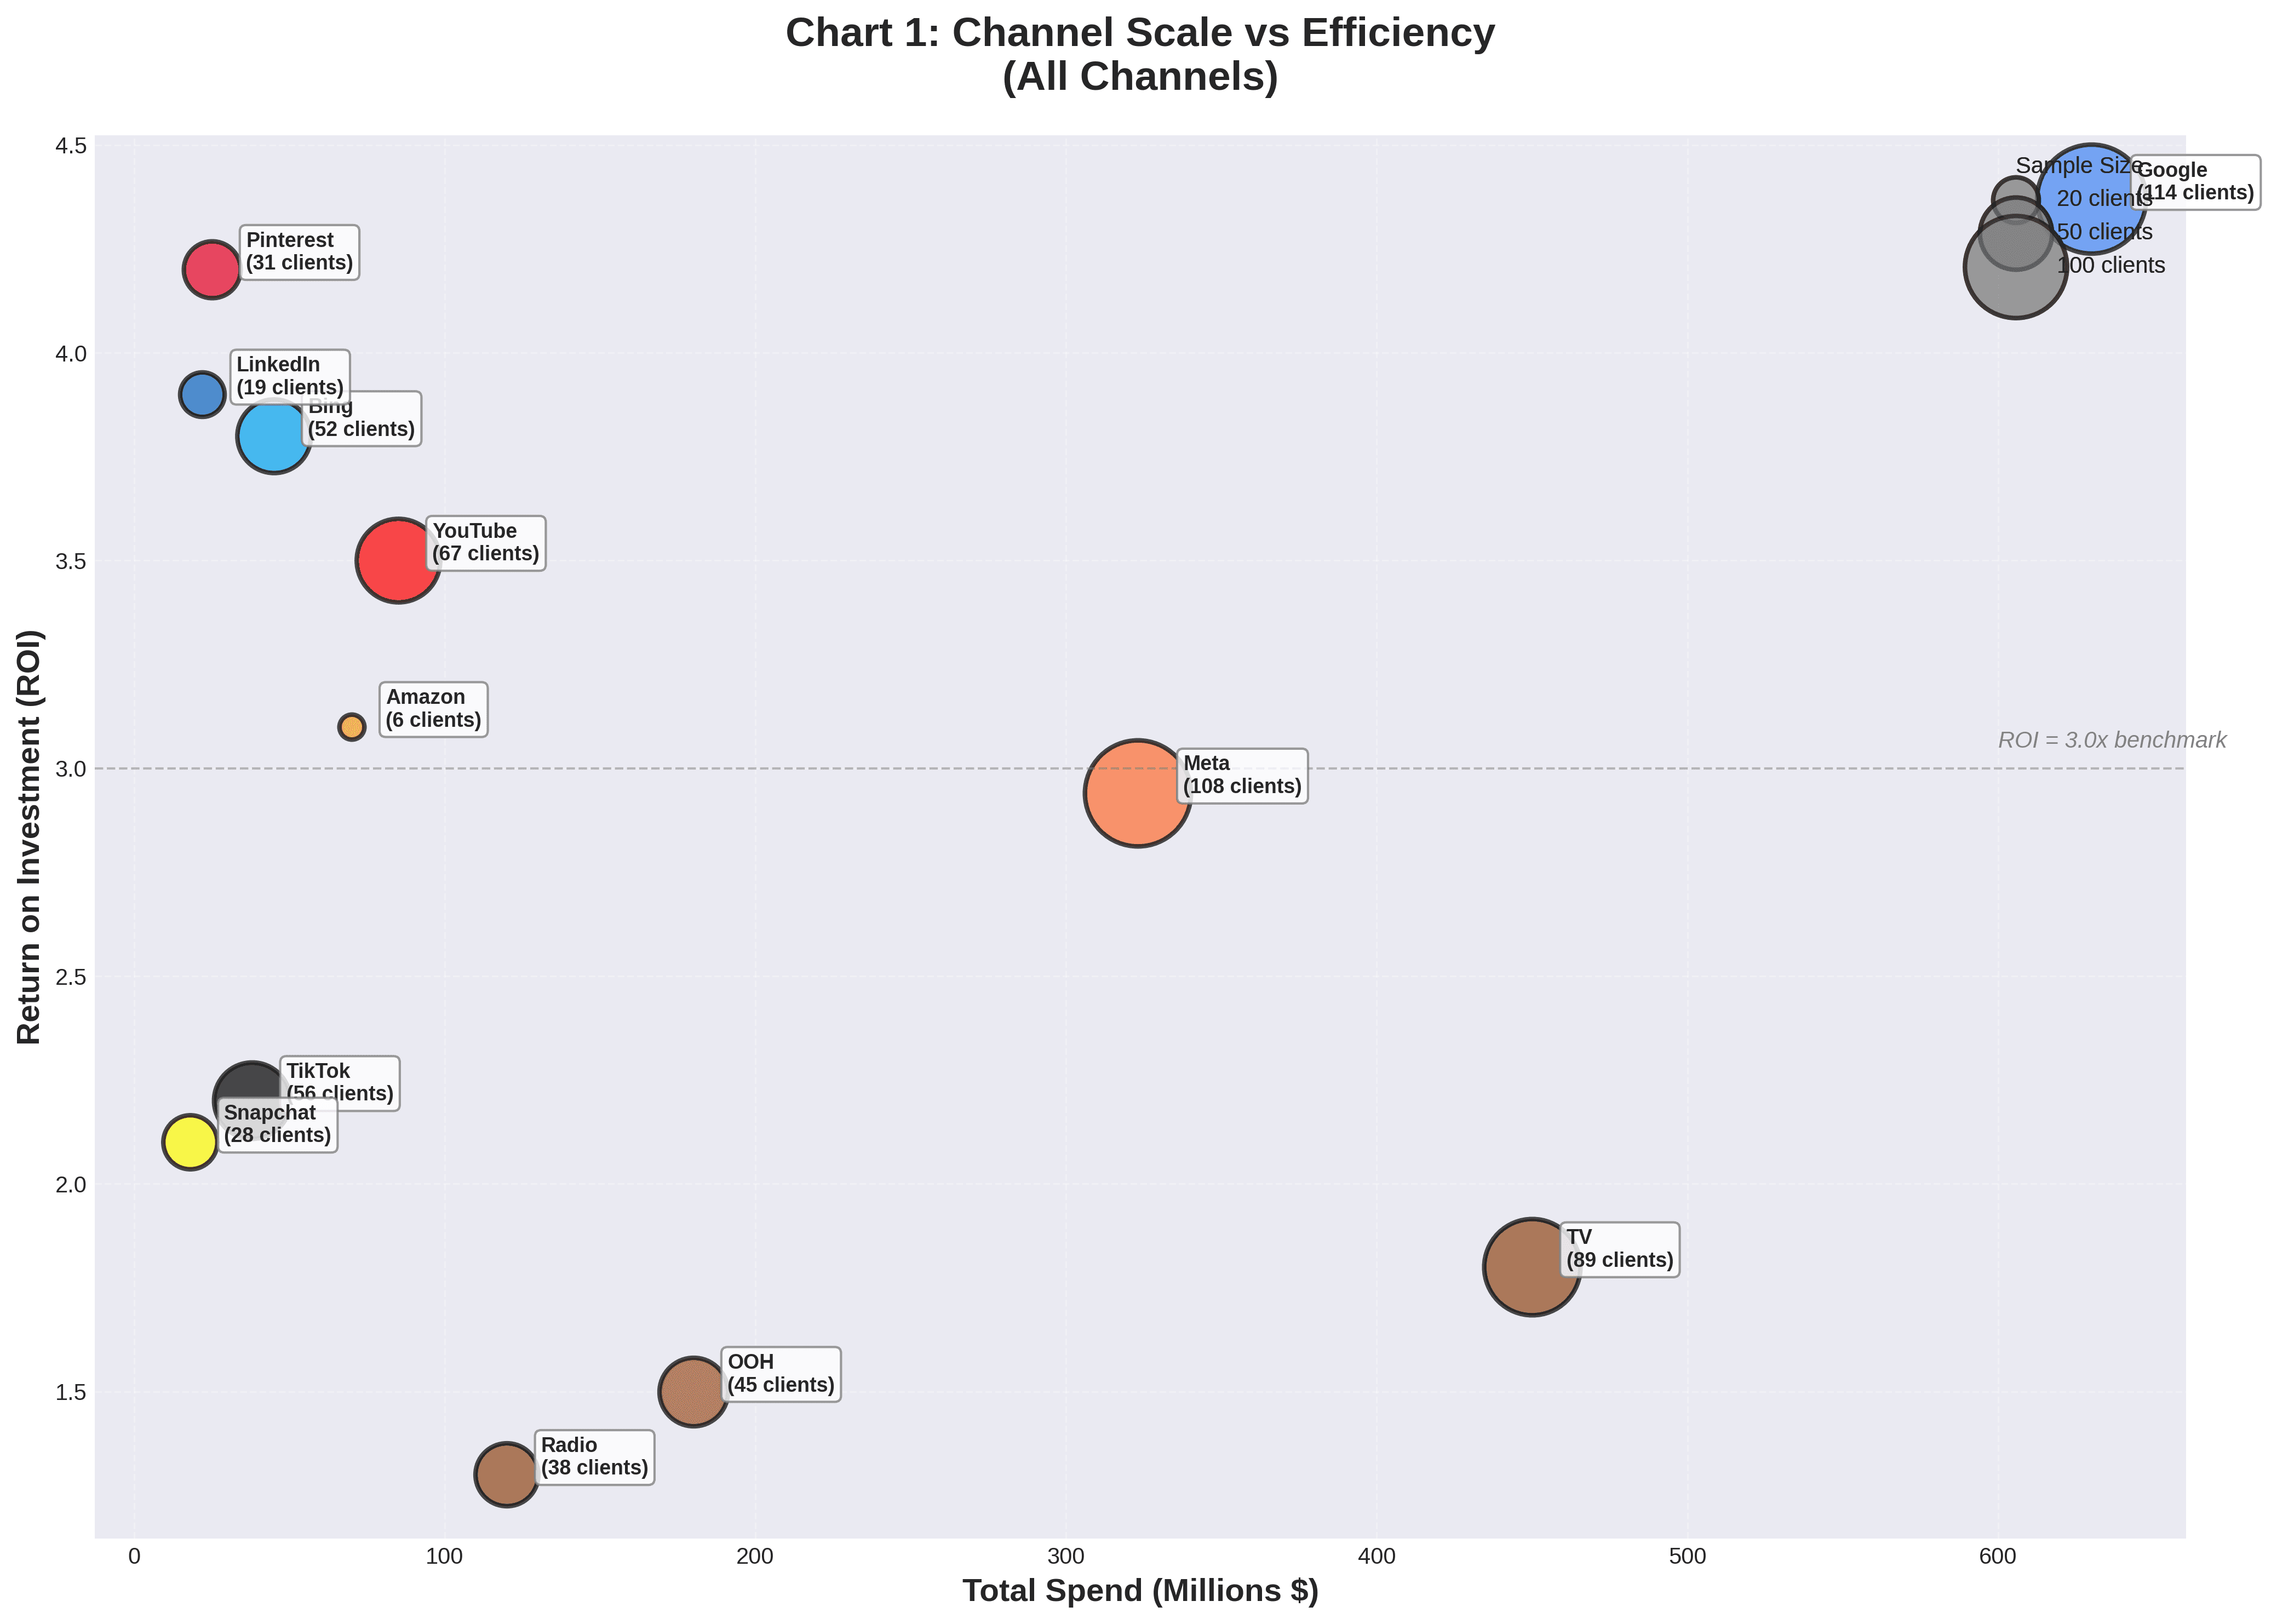
Marketing Channel Performance: Scale vs. Efficiency
The Scale Gap: Google, Meta, and Everyone Else
Google's median ROI (Return on Investment) is 4.37 across 114 clients with US$630M worth of ad spend. Meta's median ROI is 2.94, across 108 clients with US$323M worth of ad spend.
Important Context on ROI: An ROI greater than 1 is desirable but does not necessarily equate to profit. It means that for every dollar invested in paid media, more than $1 in return is expected. The ROI calculated in this analysis accounts only for the cost of advertising, not all business costs. A business can generate sustained paid media ROI above 1 and still be unprofitable if its cost structure (overhead cost of the marketing team or media agency, cost of fulfilling an order, shipping costs, etc.) is very high on a per-order basis.
Google and Meta represent the highest concentration of clients - 92% and 87% respectively of our client base. These two platforms also represent the highest concentration of spend, approximately 51% of all ad spend (out of a total of US$1.85B analyzed).
This large concentration of ad spend into two players reflects market-wide patterns. WARC reported mid-year 2025 that Alphabet (Google's parent company), Amazon, and Meta were on track to capture an estimated 55% of global advertising spend outside China. In our dataset, Amazon spend represents a smaller share than the market-wide reported equivalent.
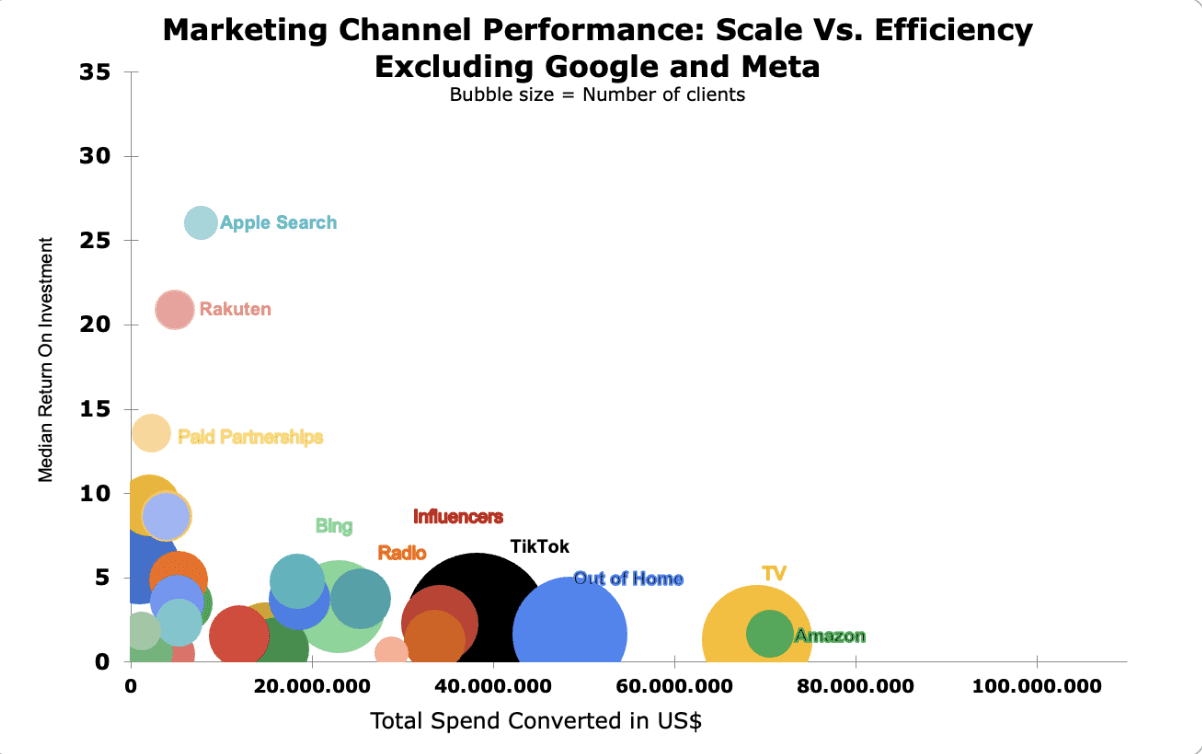
Beyond Google and Meta: The Broader Channel Landscape
When excluding Google and Meta, the picture becomes more varied. Amazon, TV, Out of Home (OOH), TikTok, influencer marketing, radio, social media, and Bing all saw more than $20M invested each, across 6 to 56 clients. Notable observations:
- TikTok shows strong adoption across 56 clients with total spend of $38M
- Amazon ranks 3rd in ad spend behind Google and Meta ($70M) but has very low client adoption (only 6 clients)
- Apple Search and Rakuten show very high median ROI but low investment amounts across few clients
Why Do Some High-ROI Channels Have Low Adoption?
Why would some channels with very high ROI have both low client adoption and low investment amounts? Three key reasons:
1. Supply Constraints
Not all channels can scale as much as Google, Meta, or TikTok. Social media inventory is a function of Daily Active User base. Meta reported 3.54 billion daily active users in October 2024 across all its consumer apps. Ads on social media are shown programmatically when browsing, and ad load (how many times and when to show an ad) is under Meta's control and can be adjusted. Therefore, supply is nearly infinite given their consumer penetration.
This is not true for demand-driven platforms like Apple Search or Bing. Ads are displayed against specific queries made by users. Not only is their penetration in daily life much smaller than social media (Bing holds about 4.31% of worldwide search engine market share as of October 2025; Google holds the lion's share), but ads are shown against specific queries. Some channels are simply supply-constrained.
2. Operational Friction
Businesses have limited capacity for managing multiple channels simultaneously. Some businesses make pragmatic choices that reflect their ability to set up campaigns and optimize them in the context of their overall paid marketing budget. Marketing budgets are not limitless. Businesses may choose to allocate resources to run ads across 3, 4, or 5 channels maximum because they anticipate more friction than benefits when fragmenting investment over too many smaller channels.
3. Uncertainty and Risk
Uncertainty matters as much as ROI. A channel delivering 10x returns with 20x variance is not necessarily better than one delivering 5x with 1x variance. The question isn't just "What's the median outcome?" but "What's the range of outcomes we need to be prepared for?"
How Uncertainty Changes the ROI Picture
Google and Meta aren't just big - they're predictable, and that predictability has strategic value beyond their raw ROI numbers.
Understanding Confidence Intervals in Marketing Analytics
A confidence interval for a given channel's ROI is a range of values that likely contains the true ROI. A narrow interval means the range is small and the estimated ROI is precise. If you were to repeat the same analysis or experiment multiple times, results would consistently fall within that range.
When the interval is wider, the range is larger, meaning the estimated ROI is less precise - either because the dataset is weaker or there is inherent volatility in the analysis output or experiment results.
Real-World Examples: Meta and Google Confidence Intervals
Meta: Median ROI of 2.94 with ROI Confidence Interval across 108 clients ranging from 2.26 to 3.99. If a brand joins Cassandra and uses our platform and statistical models, there's a very high probability that Meta ROI will land between 2.26 and 3.99.
Google: Median ROI of 4.37 with ROI Confidence Interval across 114 clients ranging from 3.30 to 5.21.
You know what you're getting with Meta and Google. For brands prioritizing scalability over lottery-ticket upside, this consistency may be worth more than chasing the next high-ROI bet.
Growth-Tier Channels: TikTok, Out of Home, and TV
TikTok, Out of Home (OOH), and TV represent channels with scale, efficiency, and moderate uncertainty. Their ROI Confidence Intervals range from 0.54 to 3.39 across these three channels. Note that adoption is much lower - up to maximum 56 clients for TikTok.
TV is challenging to test, and to some extent, OOH is too. However, OOH has enhanced operational capabilities (less time-bound commitment on large buys) and digital capabilities (connected billboards in key cities). TikTok is easy to test, and its ad platform capabilities (targeting, optimization, and measurement) are now very close to those of Google and Meta.
Brands not testing TikTok now may miss the window to learn before it becomes saturated.
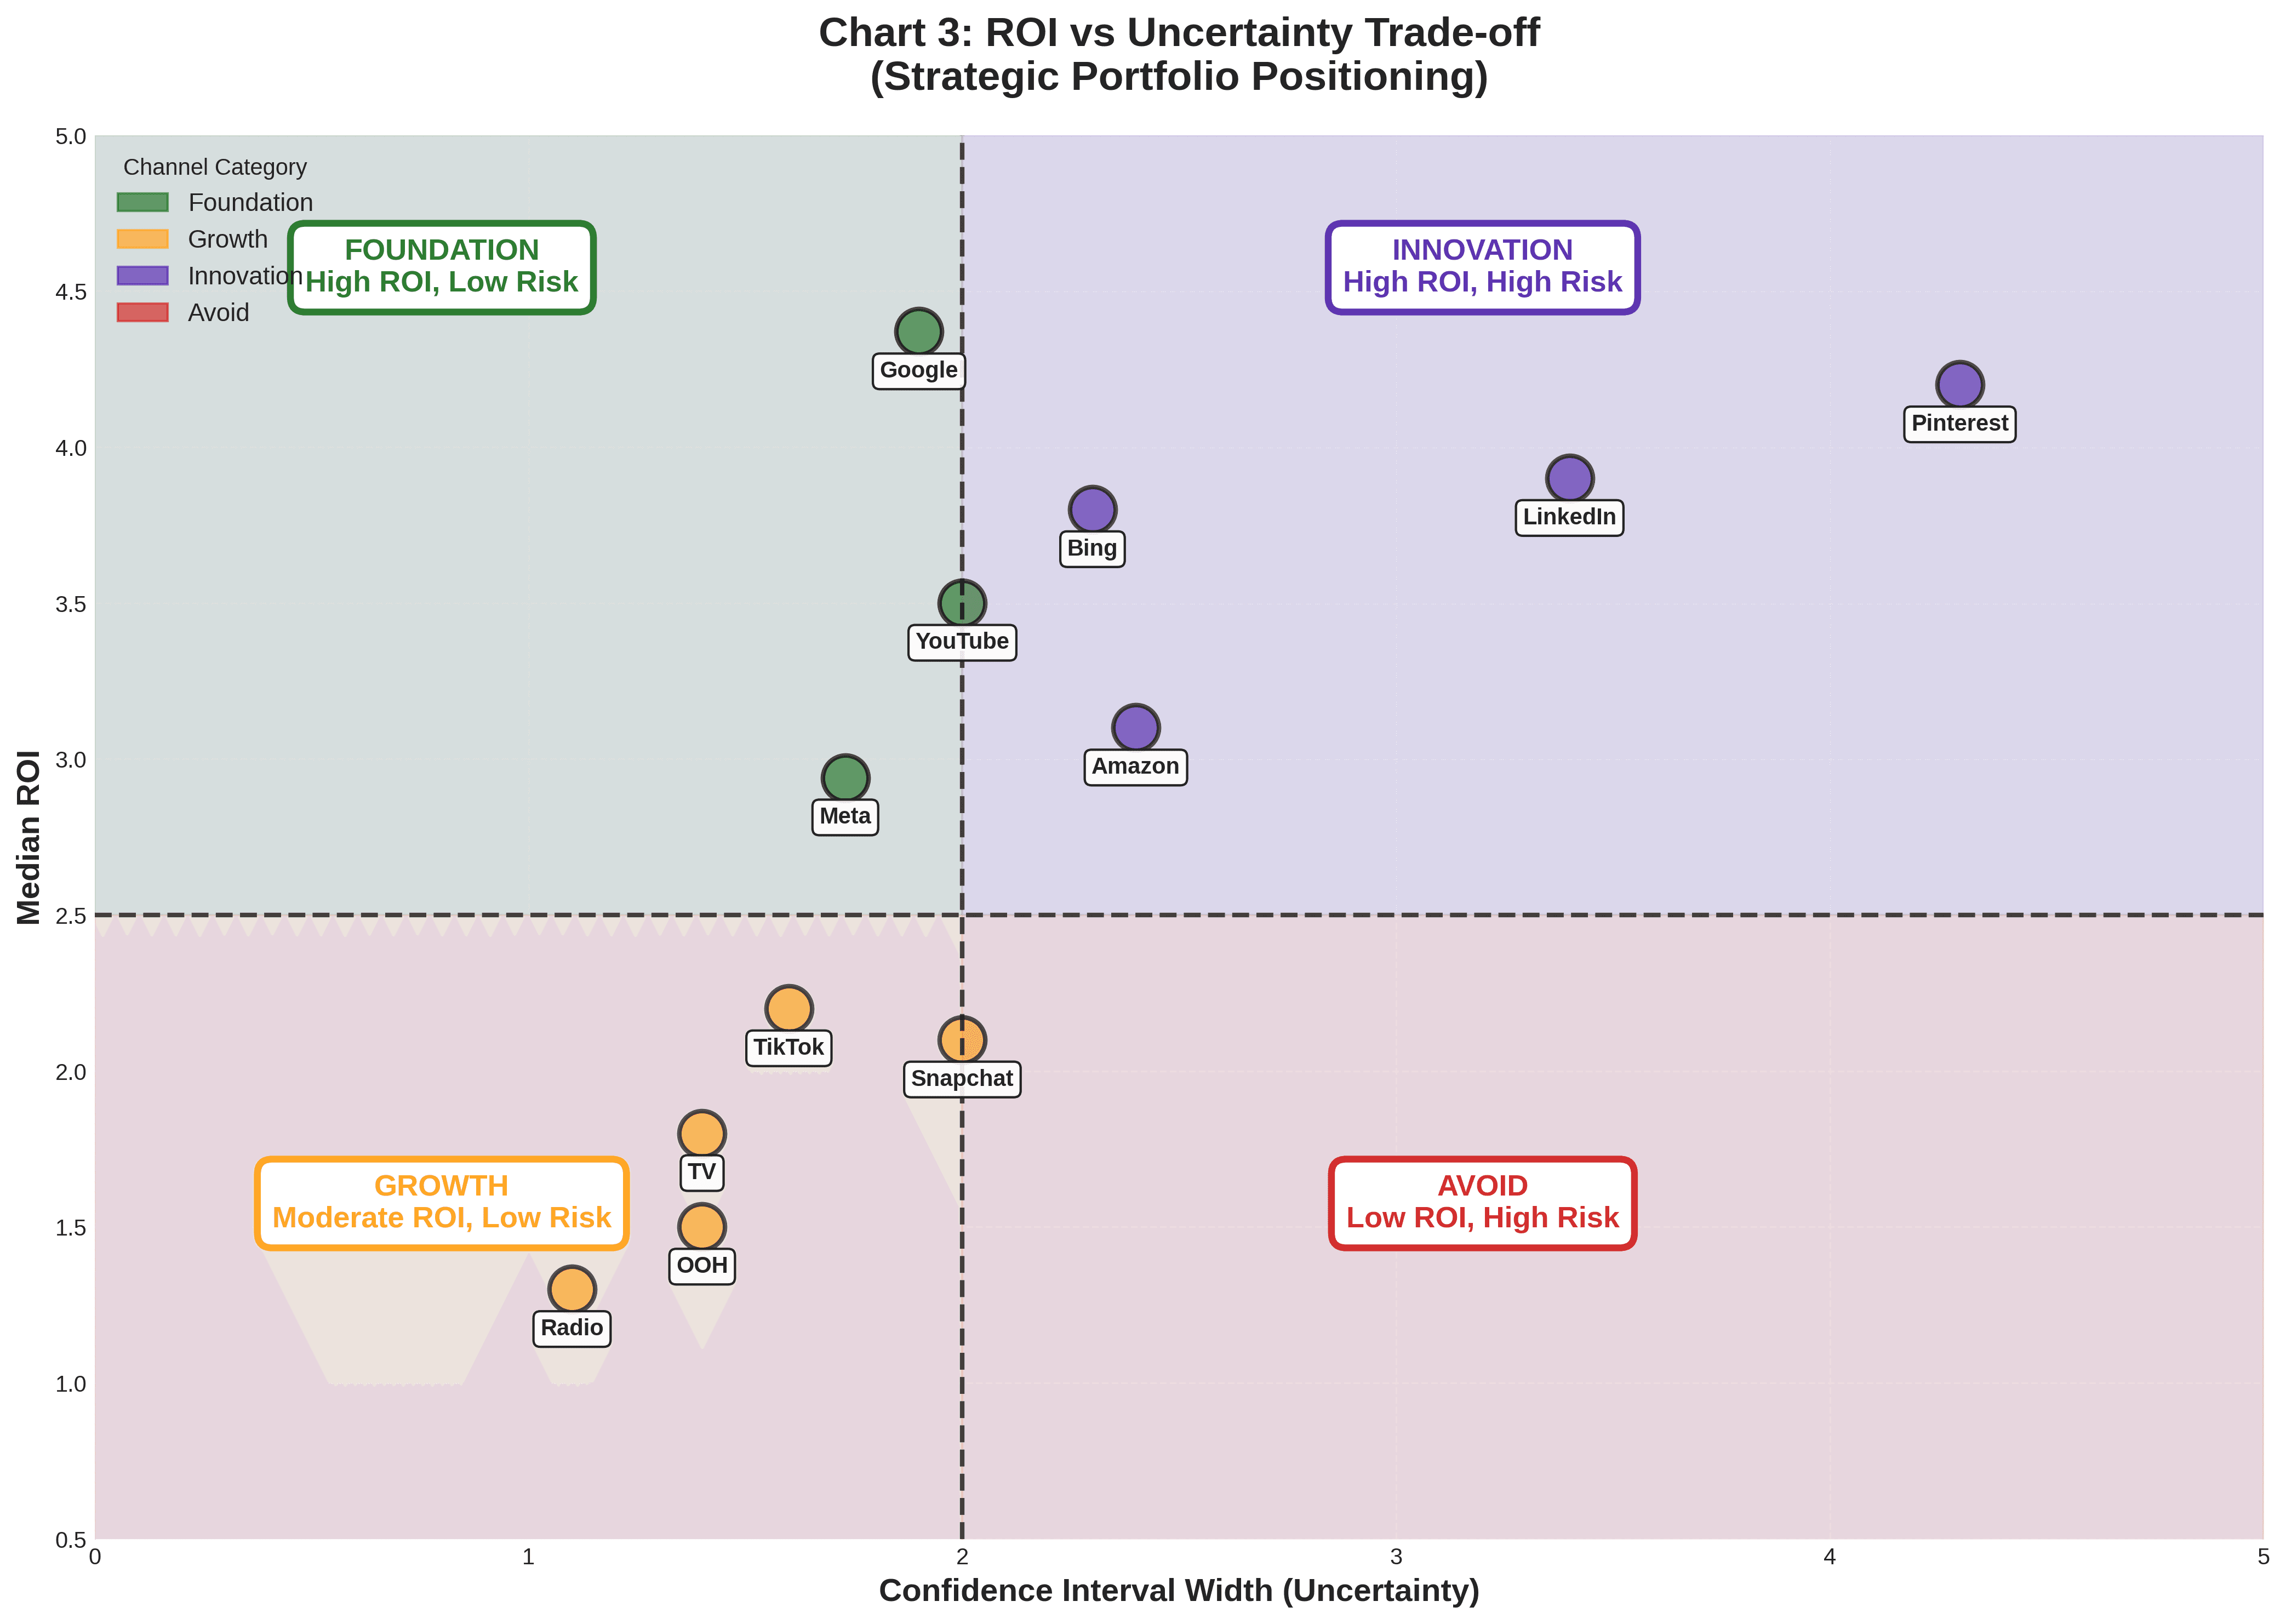
High-Uncertainty Channels Require Different Capabilities
Channels like Pinterest, Connected TV (CTV), or Apple Search tend to yield very high ROI. However, Pinterest's confidence interval width of 55.6 means some clients see 60x ROI while others observe drastically different returns. That variance is not random - it's execution-dependent.
Allocating budget to high-uncertainty channels without allocating specialized optimization and testing resources is setting yourself up for failure.
Risk-Adjusted ROI Rankings
In this context, unless resources are plentiful (in-house teams producing assets and testing very rapidly), we recommend marketers decide budget allocation by optimizing for certainty-adjusted returns, not just median ROI.
The difference between these two approaches can be drastic.
Top 10 Marketing Channels by Median ROI
The following table presents top-performing marketing channels ranked by median Return on Investment for channels adopted by at least five clients. This data offers a preliminary view of efficiency, but as discussed, it's crucial to consider associated uncertainty for a complete picture.
Marketing Channel | Total Spend (USD) | Median ROI | CI Range | # Clients |
|---|---|---|---|---|
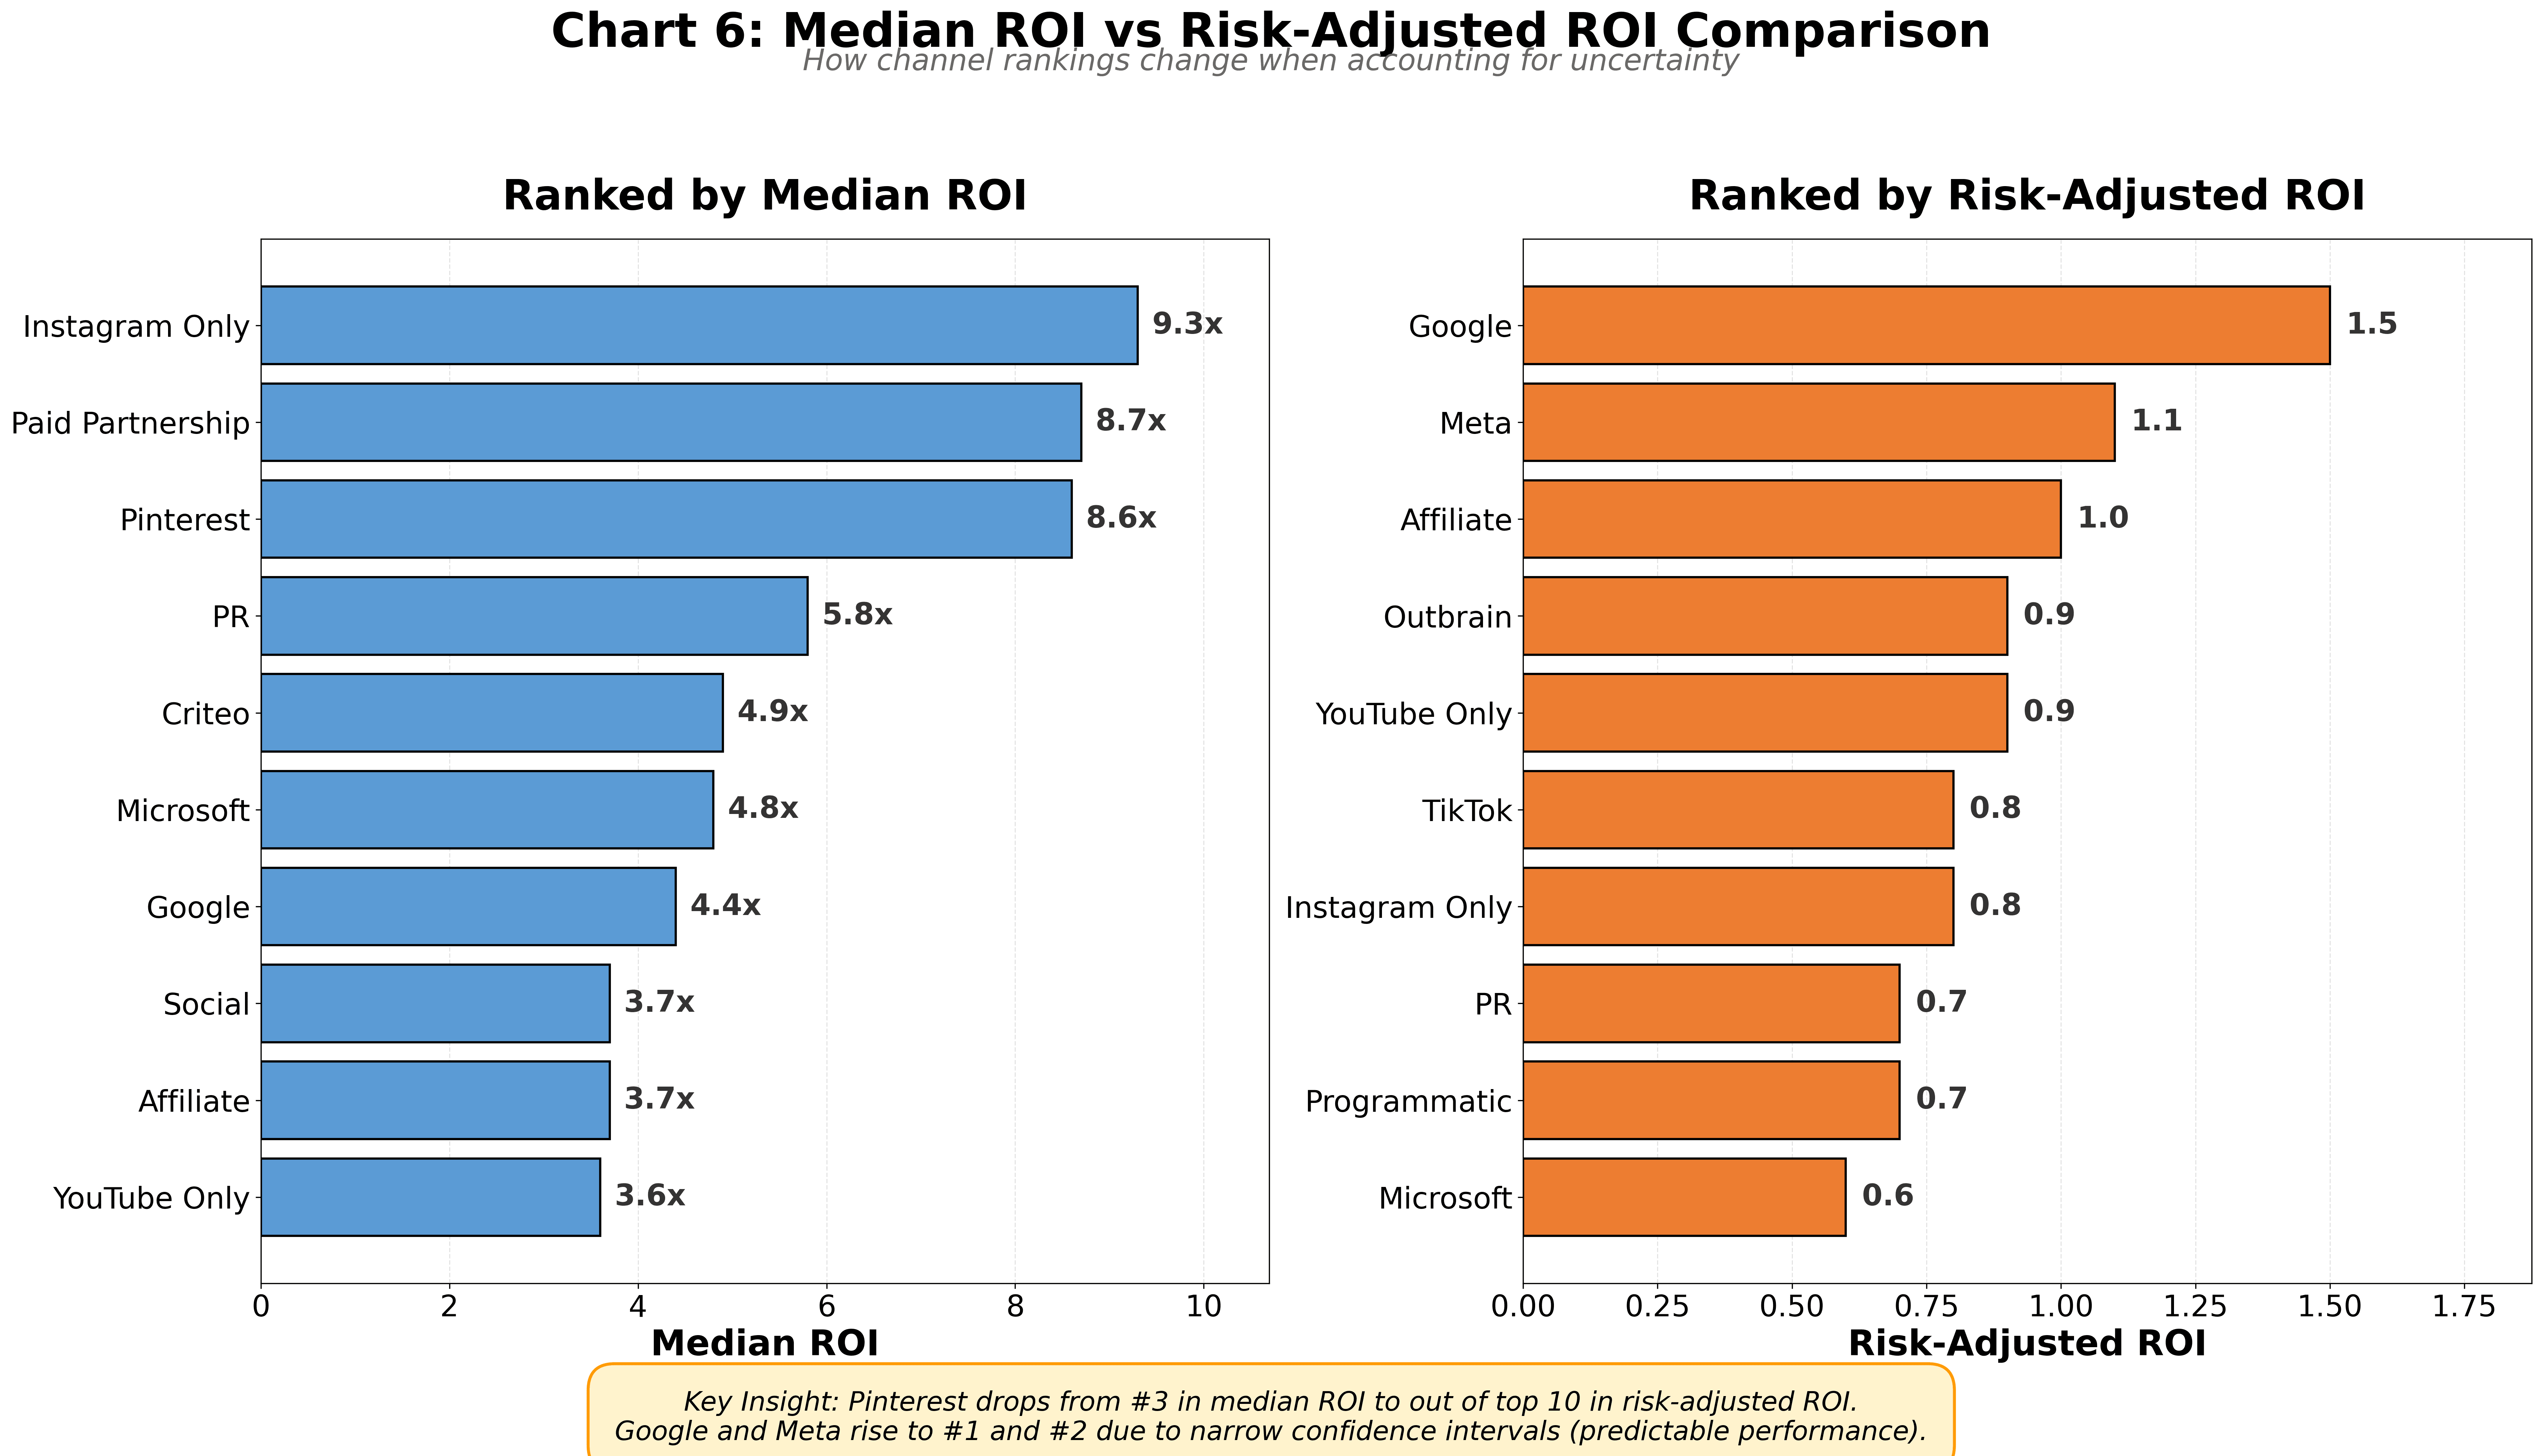
Instagram Only | $1,993,240 | 9.3x | 0.0 - 10.6 | 10 |
Paid Partnership | $3,893,616 | 8.7x | 5.6 - 22.7 | 7 |
$3,870,206 | 8.6x | 3.0 - 58.7 | 6 | |
PR | $888,270 | 5.8x | 0.0 - 7.2 | 17 |
Criteo | $5,241,946 | 4.9x | 1.1 - 17.3 | 9 |
Microsoft | $18,325,982 | 4.8x | 2.5 - 9.7 | 8 |
$630,433,974 | 4.4x | 3.3 - 5.2 | 114 | |
Social | $25,335,498 | 3.7x | 2.7 - 4.3 | 10 |
Affiliate | $18,589,659 | 3.7x | 2.9 - 5.5 | 10 |
YouTube Only | $5,080,192 | 3.6x | 1.3 - 4.4 | 8 |
Table 4: Top 10 performing channels (ranked by highest Median ROI to lowest)
We propose accounting for uncertainty by calculating a Risk-Adjusted ROI equal to Median ROI / (1 + CI Width). When ranked by highest risk-adjusted ROI, the results are vastly different.
Google and Meta return to the top as safer places to invest your marketing dollars. For example, Pinterest, with one of the highest median ROIs of 8.6, now ranks at the bottom when adjusting for its very wide confidence interval (55.6). Pinterest's risk-adjusted ROI is 8.6 / (1+55.6) = 0.15. This doesn't make Pinterest a "bad" channel - just a riskier one for now.
Top 10 Marketing Channels by Risk-Adjusted ROI
Marketing Channel | Total Spend (USD) | Median ROI | Risk-Adjusted ROI | # Clients |
|---|---|---|---|---|
$630,433,974 | 4.4x | 1.5 | 114 | |
Meta | $323,243,320 | 2.9x | 1.1 | 108 |
Affiliate | $18,589,659 | 3.7x | 1.0 | 10 |
Outbrain | $5,766,857 | 3.5x | 0.9 | 9 |
YouTube Only | $5,080,192 | 3.6x | 0.9 | 8 |
TikTok | $38,179,075 | 2.2x | 0.8 | 56 |
Instagram Only | $1,993,240 | 9.3x | 0.8 | 10 |
PR | $888,270 | 5.8x | 0.7 | 17 |
Programmatic | $11,924,259 | 1.5x | 0.7 | N/A |
Microsoft | $18,325,982 | 4.8x | 0.6 | 8 |
Table 5: Top 10 performing channels (ranked by highest Risk-Adjusted ROI to lowest)
Strategic Recommendations:
For brands prioritizing predictability: Meta may be more valuable than raw ROI suggests. For brands with limited optimization resources, Meta's consistency reduces management burden. Consider Meta as your primary mobile/social channel and Google as your primary search channel.
For brands prioritizing rapid growth: Diversification toward other channels may be beneficial as long as rapid testing can be executed when budget scales up. TikTok, Programmatic advertising, Affiliates, and Microsoft can be good options. Favor channels that remove friction to rapid, rigorous, and scientifically sound testing.
Portfolio Framework: Foundation / Growth / Innovation
At Cassandra, we envision a world where marketers adopt a portfolio approach to marketing investment, similar to how individuals and households operate in the consumer investment finance industry with their savings and investment accounts.
A three-tier portfolio framework (Foundation / Growth / Innovation) provides a practical structure for balancing scale, efficiency, and uncertainty. This framework accounts for the brand's risk appetite and resources available (or not) for riskier and innovative channels.
Three-Tier Marketing Portfolio Structure
Foundation Tier: Google and Meta. These channels offer predictable ROI with narrow confidence intervals, making them ideal for stable, scalable budget allocation.
Growth Tier: TikTok, Out of Home, and TV. These channels offer good scale and efficiency with moderate uncertainty. They require strong testing capabilities but can deliver significant returns with proper execution.
Innovation Tier: All other channels including Pinterest, Connected TV, Apple Search, Programmatic, Influencer Marketing, and emerging platforms. These channels show high variance in outcomes and require specialized optimization resources and rigorous testing.
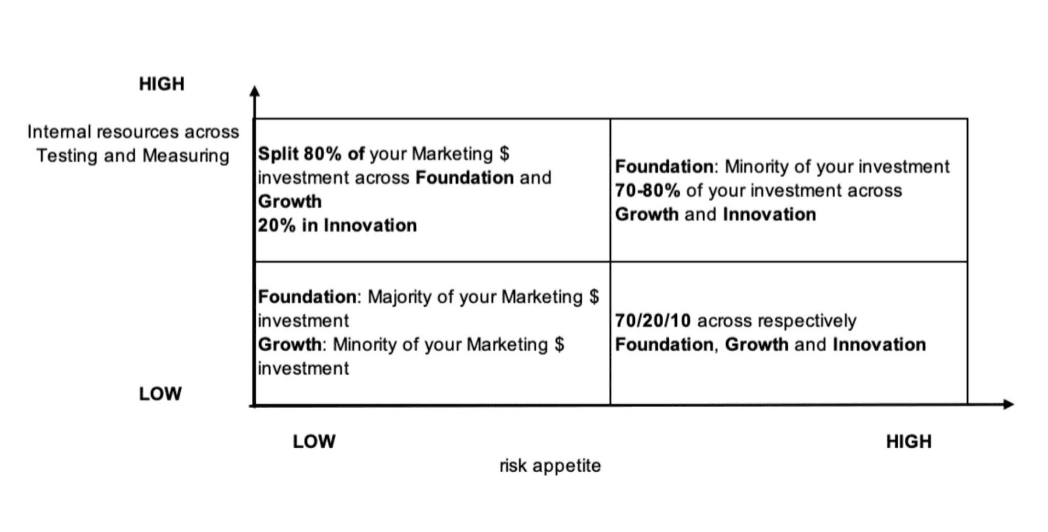
Table 6: Proposed starting framework of portfolio investment balance based on risk appetite and internal resources
The proportion of spend on proven low-uncertainty channels is a function of the brand's risk appetite and internal resources available. Important: This framework is a theoretical model that has not been extensively tested by Cassandra or the broader industry. Extensive testing in Innovation channels can lead to budget allocation decisions that may alter this initial mix.
Most importantly, this analysis demonstrates that strategic channel allocation is about managing uncertainty as much as maximizing returns. The data provides not just ROI benchmarks but uncertainty benchmarks - enabling truly risk-adjusted decision-making for the first time in marketing analytics.
Methodology & Data Behind the Benchmarks
Data and Calculation Details
Analysis Scope: Revenue models only, meaning only Marketing Mix Models whose dependent variable was revenue.
Analysis Period: 2020-2025 in the Cassandra portfolio of clients
Data Coverage: 1,221 revenue models, 123 brands, 83 channels, $1.85B spend
Geographic Coverage: Global
Vertical Coverage: Consumer Discretionary, Communication Services, Health Care, Consumer Staples, Industrials, Financials
Methodology: Marketing Mix Modeling (MMM) with uncertainty quantification
Key Calculations
Aggregate ROI: Total revenue attributed to the channel by the model / Total spend
Median ROI: 50th percentile of individual model ROIs
Mean ROI: Average of individual model ROIs
Confidence Intervals (90%, not 95%): Calculated using bootstrap resampling (1,000 iterations). Bootstrap method uses random sampling with replacement. CI Width = Upper 95th percentile - Lower 5th percentile. Only calculated for channels with greater than 2 records.
Coefficient of Variation: CV = Standard Deviation / Mean. Normalizes variability relative to average performance and allows comparison across channels with different ROI scales.
Currency Normalization: All amounts converted to USD using historical exchange rates
Known Limitations
Revenue Models Only: Analysis excludes 598 models focused on Conversions, New Customers, or Orders. Full-funnel impact may differ.
Survivorship Bias: Only includes brands that completed MMM studies; may exclude failed or very small brands that never reached the testing phase.
Attribution Windows: MMM measurement windows vary by client (typically 7-90 days); may undervalue long-term brand-building effects, particularly for awareness channels.
Sample Size Variance: Some channels have 1-6 clients, limiting statistical significance. High uncertainty for these channels may be sample artifacts, not true performance variance.
Timeframe Aggregation: Combining 5 years of data (2020-2025) may obscure recent platform changes, algorithm updates, and market trends. Recent entrants like TikTok may show different patterns in 2024-2025 than the full period.
Cross-Vertical Analysis: Aggregating across all verticals may mask vertical-specific performance. A channel with high uncertainty cross-vertical may be highly consistent within a single vertical.
Classification Quality: 10% of spend classified as "Unknown Channel." 31% of records lack campaign_type classification. This limits ability to benchmark campaign-level tactics.
Platform Changes: Meta and Google have introduced significant new features (Advantage+, Performance Max) during the analysis period. Historical data may not reflect current platform capabilities.
Frequently Asked Questions (FAQ)
What is the difference between ROI and Risk-Adjusted ROI?
Traditional ROI shows the median return across all observations, but it doesn't account for variability. Risk-Adjusted ROI divides median ROI by (1 + Confidence Interval Width) to penalize channels with unpredictable outcomes. This gives marketers a more realistic view of what to expect when planning budgets and forecasting results.
How should I interpret confidence intervals in marketing analytics?
A confidence interval represents the range where the true ROI is likely to fall. Narrow intervals indicate consistent, predictable performance across different contexts. Wide intervals suggest high variability - meaning results depend heavily on execution quality, creative performance, targeting accuracy, and other factors. Channels with wide confidence intervals require more sophisticated testing and optimization capabilities.
Why do Google and Meta perform so well in risk-adjusted rankings?
Google and Meta combine strong median ROI with narrow confidence intervals. This means they deliver consistent returns across different brands, budgets, industries, and execution contexts. Their advanced optimization algorithms, massive scale, and sophisticated targeting capabilities contribute to this predictability, making them lower-risk foundation channels for most marketing portfolios.
Should I avoid channels with high uncertainty?
Not necessarily. High-uncertainty channels can deliver exceptional returns with proper execution. However, they require stronger internal capabilities: dedicated optimization resources, rapid creative testing frameworks, rigorous measurement, and willingness to experiment. Brands with limited resources should start with foundation channels, while brands with sophisticated marketing operations can successfully leverage innovation-tier channels.
How often should I update my media mix based on these benchmarks?
Benchmarks provide directional guidance, not absolute truth. Use them as a starting hypothesis, then validate with your own data through incrementality testing, Marketing Mix Modeling, or controlled experiments. Review your media mix quarterly, adjusting based on your specific performance data, competitive dynamics, and business objectives. The advertising landscape evolves rapidly - what works today may need adjustment in 6-12 months.
What is Marketing Mix Modeling (MMM)?
Marketing Mix Modeling is a statistical analysis technique that quantifies the impact of various marketing activities on sales or other KPIs. MMM uses historical data on marketing spend, sales, and external factors (seasonality, promotions, macroeconomic conditions) to isolate the incremental contribution of each channel. Unlike last-click attribution, MMM accounts for interactions between channels, diminishing returns, and delayed effects. Learn more about Marketing Mix Modeling.
How does seasonality affect these benchmarks?
The benchmarks aggregate data across multiple years and seasons, smoothing out seasonal variations. However, individual channel performance can vary significantly by season. For example, retail channels typically see compressed ROI during high-competition periods like Black Friday/Cyber Monday due to increased CPMs and saturation. Brands should layer seasonal adjustments on top of these annual benchmarks when planning quarterly budgets.
Can I apply these benchmarks to my specific industry?
These benchmarks aggregate data across Consumer Discretionary, Communication Services, Health Care, Consumer Staples, Industrials, and Financials verticals. Performance can vary significantly by industry. For example, B2C e-commerce brands may see different patterns than B2B SaaS companies. Use these benchmarks as a starting reference point, but prioritize building industry-specific and brand-specific data through your own measurement programs.
What is incrementality in digital marketing?
Incrementality measures the true causal impact of marketing spend - the sales or conversions that would not have occurred without the marketing activity. Not all attributed conversions are incremental; some users would have converted anyway. Incrementality testing (through geo-experiments, holdout tests, or Marketing Mix Modeling) helps marketers understand the true ROI by isolating the incremental effect of each channel. Learn more about incrementality testing.
How can I get started with risk-adjusted budget allocation?
Start by auditing your current media mix and performance data. Identify which channels show consistent ROI versus high variability. Use the Foundation/Growth/Innovation framework to rebalance your portfolio based on your risk appetite and internal capabilities. Consider implementing Cassandra's MMM platform to quantify uncertainty in your own data and optimize budget allocation with confidence intervals built into the planning process.
Authors
Gabriele Franco is the founder and CEO of Cassandra and shaped the vision behind this analysis, which aligns with Cassandra's mission. Gabriele reviewed the final write-up.
Nicolas Arrivé is the Director of Operations and Partnerships at Cassandra and joined full-time in 2025. He shaped the narrative and analytical details of this analysis.
AI Usage Disclosure
We use AI agents to auto-generate three elements:
- Labeling of campaign types across hundreds of models (done 100% or partially by AI agents) to homogenize different naming conventions describing media activities (e.g., remarketing and retargeting are the same media tactics). This is done when we onboard advertisers and build models.
- A first analysis draft, heavily reviewed and redacted by both Nicolas and Gabriele to account for nuances around uncertainties (confidence intervals) and their interpretations.
- A proposed write-up structure, heavily redacted and modified to make it more to-the-point, engaging, and relevant to marketers.
References
- eMarketer November 2024 forecast: Global Ad Spending Forecast
- Statista: Advertising Market Outlook
- Spherical Insights 2023 projections: Consumer Finance Market Report
- WARC: Alphabet, Amazon, and Meta Market Share Analysis
- Meta Q3 2025 Results: Meta Investor Relations
- StatCounter: Search Engine Market Share
Get Started with Cassandra
Ready to optimize your marketing budget with risk-adjusted insights? Learn more about Cassandra's Marketing Mix Modeling platform and start making data-driven decisions that account for both returns and risk.