learn
/
mmm
Why Attribution Misleads Budget Decisions (Real MMM Case)
A real marketing mix modeling case shows how last-click attribution skews channel ROAS and budget allocation—and what to do instead to grow efficiently.


Get a weekly dose of insightful people strategy content
Date: October 23, 2025
Abstract
Digital marketers often rely on platform attribution to evaluate channel performance and allocate budget.
This article will demonstrate, with a real example:
a) why platforms attributions don't always provide the best information to allocate your marketing budget
b) offer an alternative that can improve the marketing teams ability to deploy effective advertising capital.
We run a comparison between attribution level measurements and MMM measurement to derive what is the best measurement framework and showcase the results generated by following the insight of each methodology.
Keywords: marketing mix modeling, attribution, causal inference, budget allocation, Hill function, adstock, incrementality.
1. Introduction
Performance marketing teams typically measure channel contributions leveraging in-platform attribution (e.g., last‑click, multi‑touch). While operationally convenient, attributions able to pinpoint the last channel or touchpoint visited by the buyer before making a purchase, not showcasing the real incrementality effect that the channel has and, therefore, misleading decision on advertising budget allocation
Attribution's key limitation is that it can only credit conversions to campaigns that include user clicks—typically bottom-of-funnel campaigns—leaving top-of-funnel efforts unmeasured.
In this article we will address:
- Does attribution make sense?
- Baseline: Does attribution ignore baseline conversions?
- CPA Bias: Do attribution CPAs significantly differ from MMM CPAs?
- Allocation Divergence: Do allocation decisions differ under attribution vs. MMM?
- Financial Impact: How a small change in budget generated +18% in conversions with the same budget
- How to run this analysis with your data
Our analysis will focus on Google Ads for Search Ads and Video Ads. For these two channels, I will compare Attribution and MMM
2. Data and Pre‑Processing
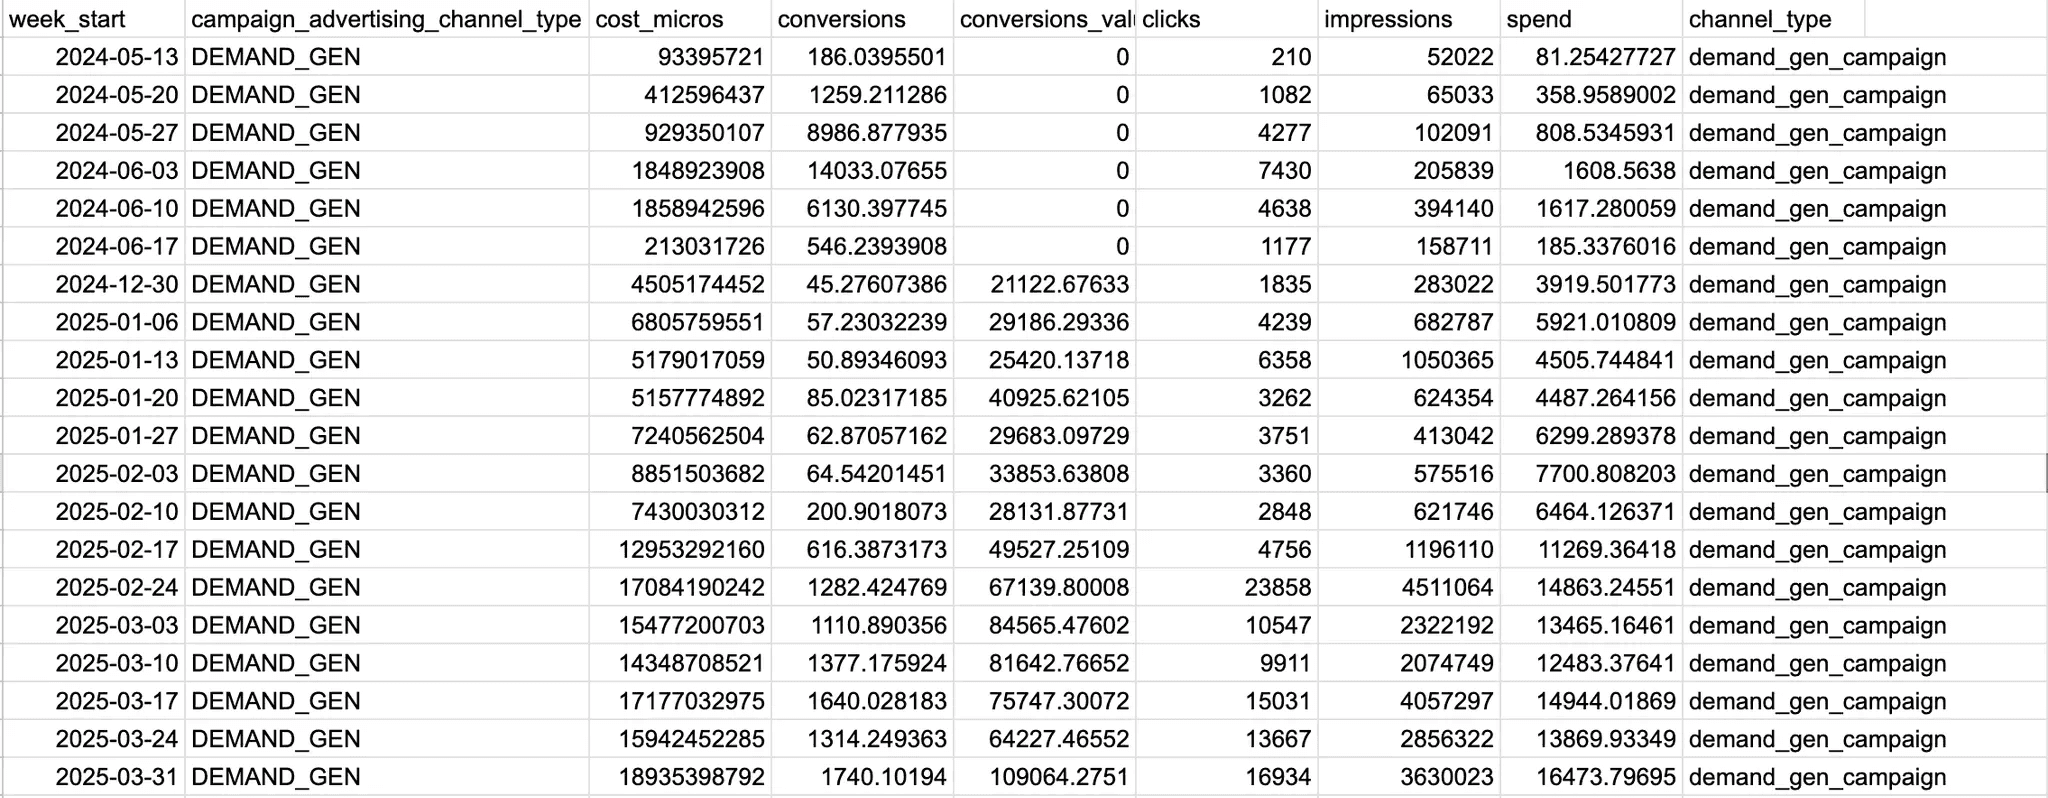
- We download from google ads a report for the past 3 years with the following structure:
dimensions: date (daily/weekly) , campaign type
- Metrics: cost_micros, conversions
- Click here to see the data source
- Scope. we focus for simplicity to google ads campaign types, specifically comparing Search with Google video.
- Targets. Conversions for both attributions and MMM
3. Do attributions make sense?
3.1 Comparing attributions with total conversions from google ads
The following data is from an anonymized client case study conducted by Cassandra.
total conversions from CMS: 121,392
Total google ads attributed conversions: 162,112
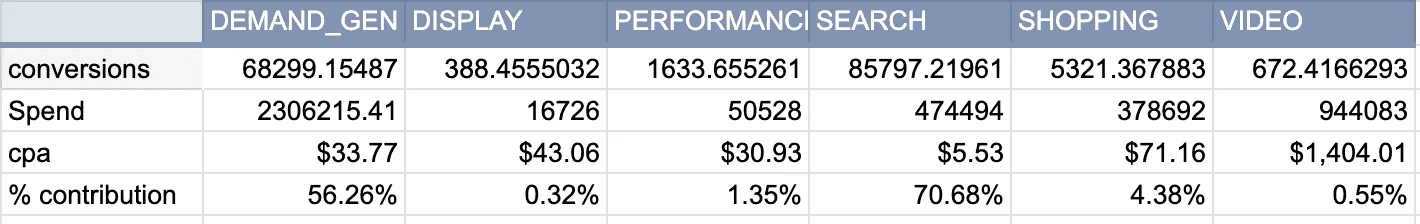
in the following table you see:
- Attributed conversions (first row)
- Spend (second row)
- Cpa - cost per conversion (third row)
- % contribution vs total sales from crm (fourth)
the contribution percentage is calculated as: % Contribution = (attribution / total conversions)*100
Summing the values in the last row, we should get a % value smaller than 100%.
One advertising channel cannot contribute to more than 100% of total sales.
in this case, though, if we sum it up we obtain: 133.54%
According to google ads attribution, google ads campaigns contribute to more than the total sales generated by the brand
This is unrealistic for a real life scenario.
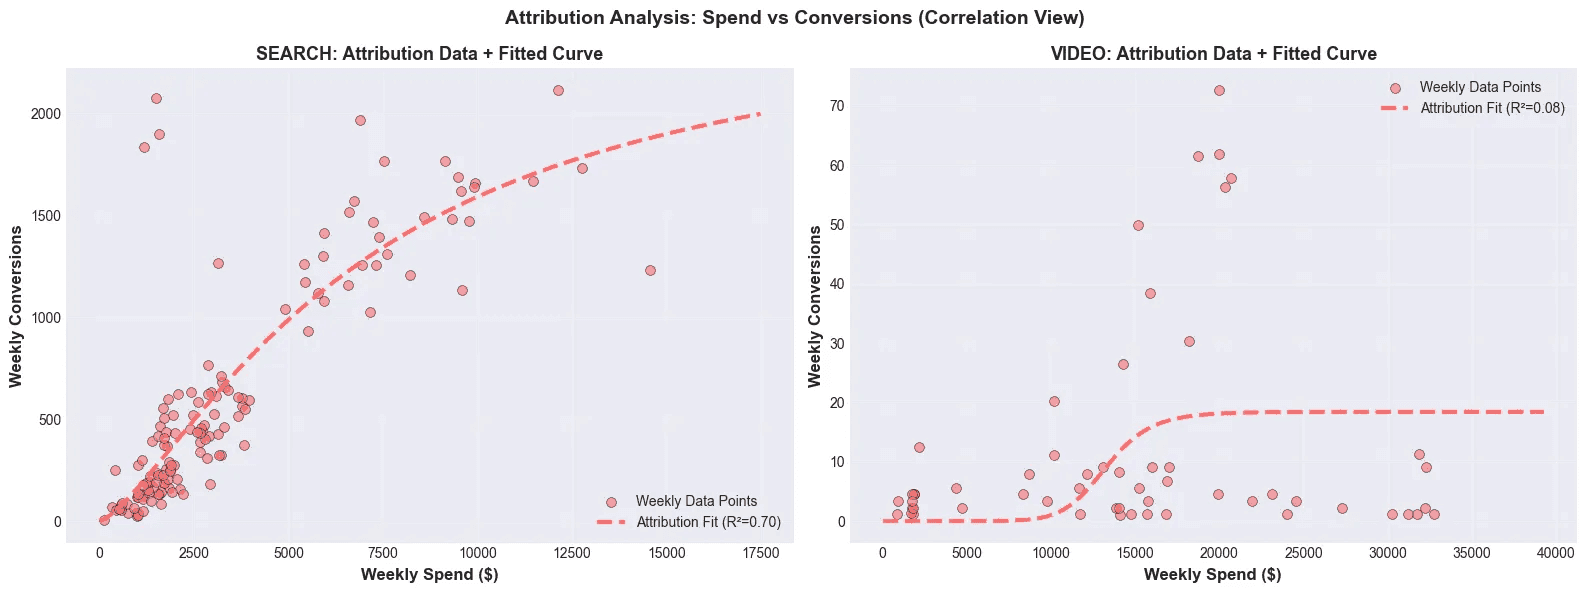
3.2 Diminishing returns (google video and search):
Creating a scatterplot of spend per each campaign type using cost in the x axis and attributed conversions in the y axis we can see:
Google search seem to be a super efficient channel compared to google video which seems to be extremely inefficient.
4. Comparison with MMM
4.1 MMM Specification (incremental conversions)
We built a Marketing Mix Model using Cassandra
The Marketing Mix has been trained with 5 advertising channels + seasonality + baseline
We tested through a incrementality experiments google search and google video.
These are the results:
- R^2: 85%
- NRMSE (prediction error on test data): 9%
- Calibration error from a Geo-Match: 4%
4.2 Contribution analysis
Component
Conversions (MMM)
% of Total (MMM)
Component | Conversions (MMM) | % of Total (MMM) | Conversions (Attributions) | % of total (attributions) |
|---|---|---|---|---|
BASELINE | 88,428 | 72.35% | 0 | 0% |
Search | 4,721 | 3.86% | 85,897 | 70.6% |
Video | 7866 | 6.8% | 672 | 0.55% |
Other | 20,378 | 16.7% | 0 | 0 |
KEY FINDING:
- The highest % of attributed search conversions is not incremental, but baseline contribution.
- Baseline represents the sales generated if we stopped advertising completely. It includes trend, seasonality, and events.
- Most Search-attributed sales are not incremental—they would have occurred even without investment and it’s accounted in the MMM by the estimation of the baseline and Search.
- The incremental impact from Google Search differs significantly from what attribution suggests.
How much do they differ?
SEARCH: Attribution 70.2% vs MMM 3.9% (Diff: 19x less) VIDEO: Attribution 0.6% vs MMM 6.8% (Diff: 11x bigger)
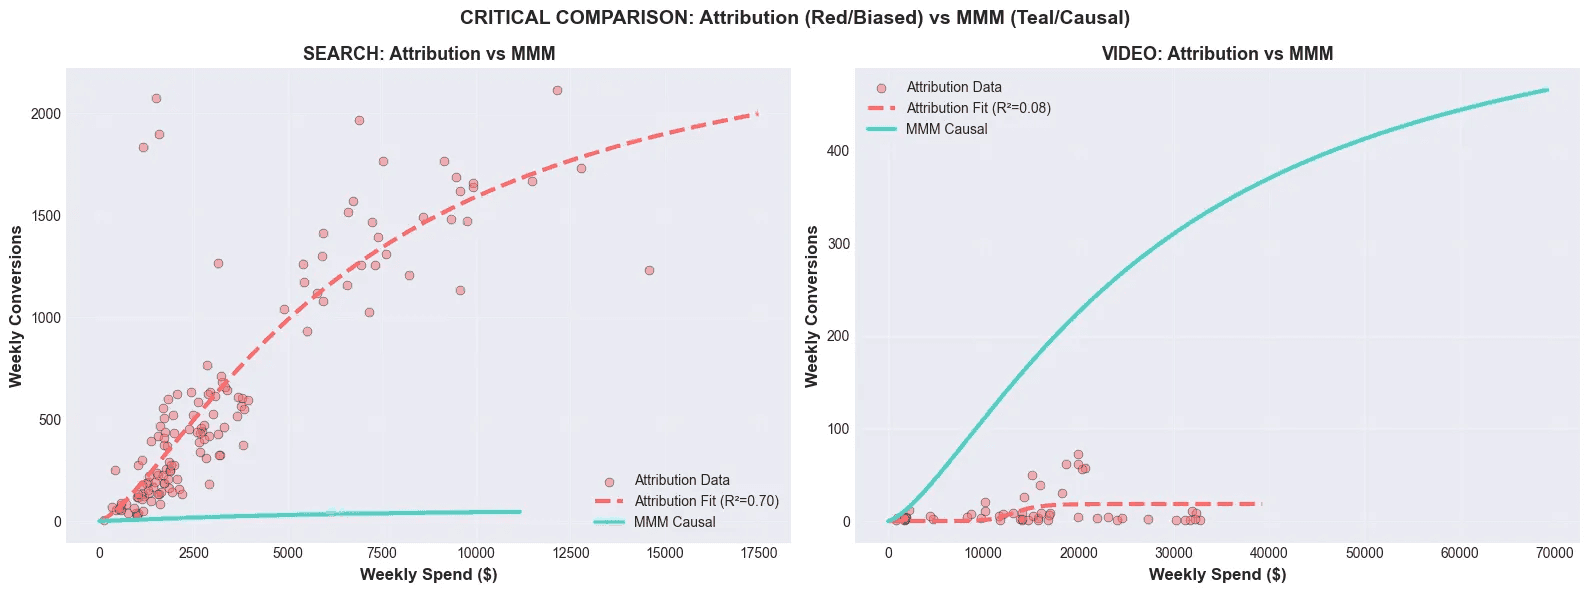
4.3 Diminishing returns comparison
in Red the attributed sales in blue the one found with the model
Google video that seemed a worst channel, according to attributions, in the MMM seem to be generating a higher incrementality effect compared to search
The two channels have completely opposite estimations in performances
4.4 CPA comparison
Channel | Attr CPA ($) | MMM CPA ($) | difference % |
|---|---|---|---|
SEARCH | 5.5 | 452 | +7218 |
VIDEO | 1404 | 147 | -89% |
Our main hypothesis for this major difference:
Attribution can only credit campaign types that prompt users to click an ad and then convert. Google Video doesn't encourage clicks within its user experience, making it impossible for attribution to detect its sales impact.
MMM, on the other hand, is unaffected by this limitation. It measures all campaign types the same way, regardless of their click behavior or funnel stage.
Given this explanation, we need to determine which method better estimates the incremental effects of these two campaign types.
5. Experiments
5.1 Always validate the incrementality effect using experiments
Ran two experiments using GeoMatch to validate what system to follow for budget allocation
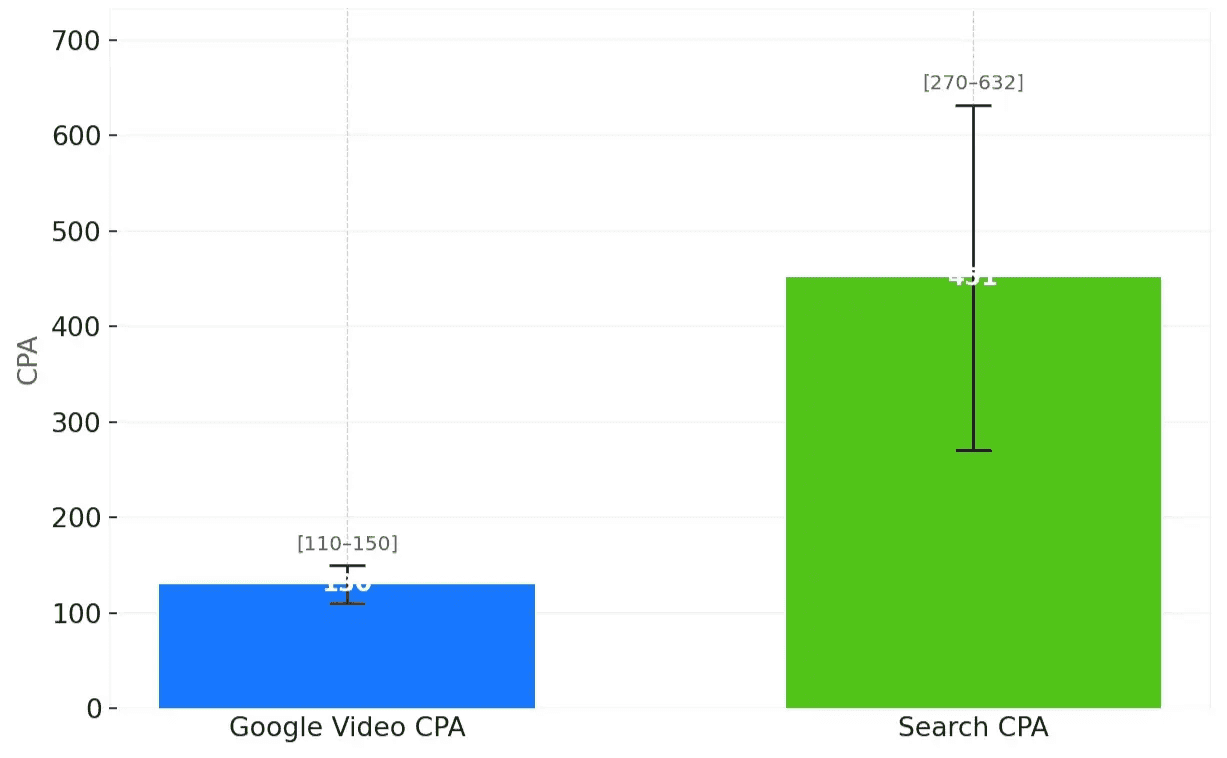
The results:
- Google video CPA: [110-150]
- Search CPA: [270-632]
Results Explanation:
When running a Geo-experiment, you obtain an estimated number of incremental conversions. In the case of Google Video, the calculated Incremental Cost Per Conversion varies between $110 and $150 with a confidence interval of 90%. It means that if we were to repeat the exact same experiment 100 times, 90 times the incremental CPA will be between these two values. At the same time, if we repeat the experiment for Google Search, 90 times out of 100 the incremental CPA will be between $270 and 632$
5.2 Budget shift
We moved 25% of the budget from Search to Video and waited 30 days to see if we were able to detect a lift
This shift allowed us to unlock 18% more conversions out of the same marketing budget (based on a 30-day observation window in this anonymized case study).
Based on this evidence, here are our conclusions:
- Attribution contributes to 130% of total Sales. It is unrealistic. It is so unrealistic that Attribution cannot be trusted for budget re-allocation as it tends to work in silo not communicating with total sales and be biased towards one specific bottom funnel channels”
- MMM and Incrementality experiments used sophisticated casual inference techniques for measurements and their estimation match even if the measurement methodologies are different.
- We conclude that in the context of a Marketing Mix with multiple campaign types that work at different funnel stage, MMM and incrementality testing have less technical bias than attribution
- A positive lift observed after implementing a small budget change as suggested by the MMM provides evidence that supports its reccommendiations. This results shows that MMM can guide budget attribution more precisely than attribution, making it ideal for decision-making
6.0 How to run this analysis:
Check if your attributions are misleading you too:
- Download all your sales data from crm and/or cms:
Dimensions: date (daily/weekly)
- Metric: sales, revenue, new customers
- Download from google ads and facebook ads a report with these format:
dimensions: date, campaign type, campaign name
- metrics: spend, conversions, conversion_values
PS report naming convention might vary based on the ad account
- Upload the data into this template
- Check if attributions make sense: sum attributions and compare it with total sales to check if the total attributed sales are less than total sales.
- Use Cassandra to build a MMM — start your free trial or book a demo to have our team build it for you
- Discover how to allocate your marketing budget to maximize sales
PS: to build a model you’ll need the right data, if you don’t have a ready to use dataset I suggest to book a call to have our team use connectors to collect the data and build your model on your behalf
