



See the real result of every campaign.

See the real result of every campaign.

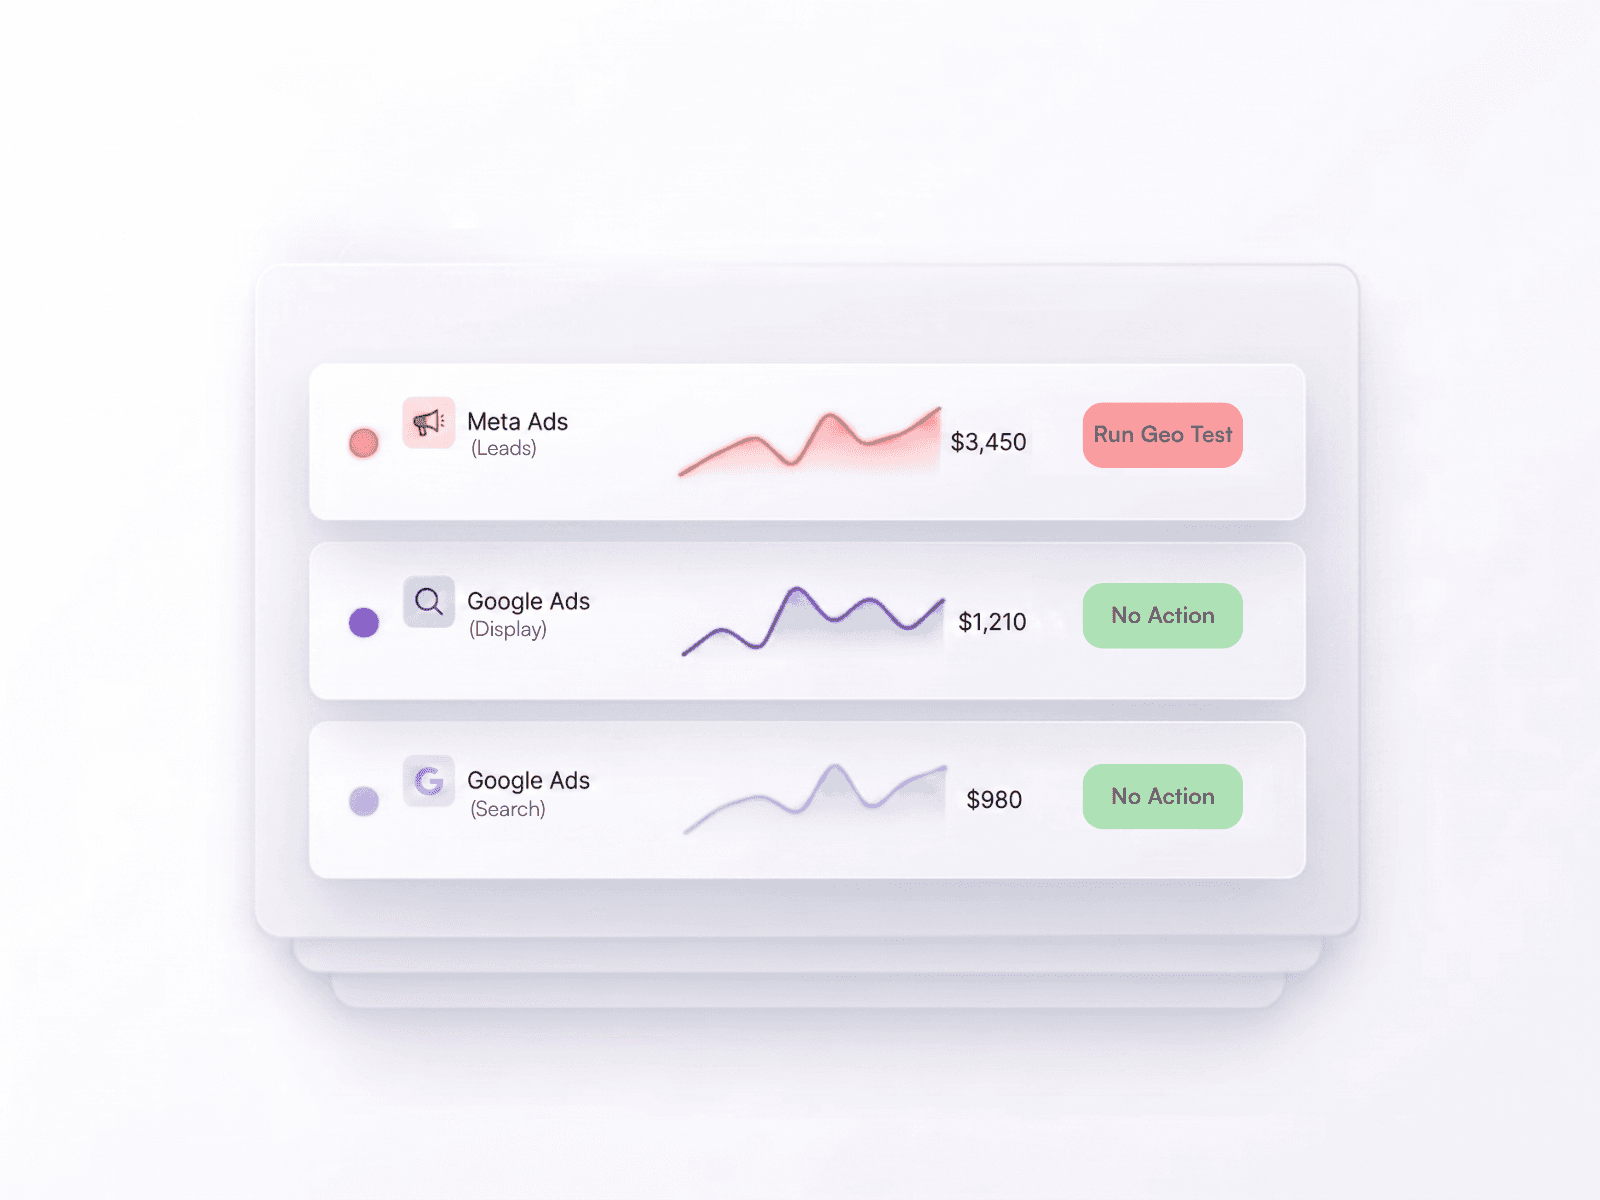
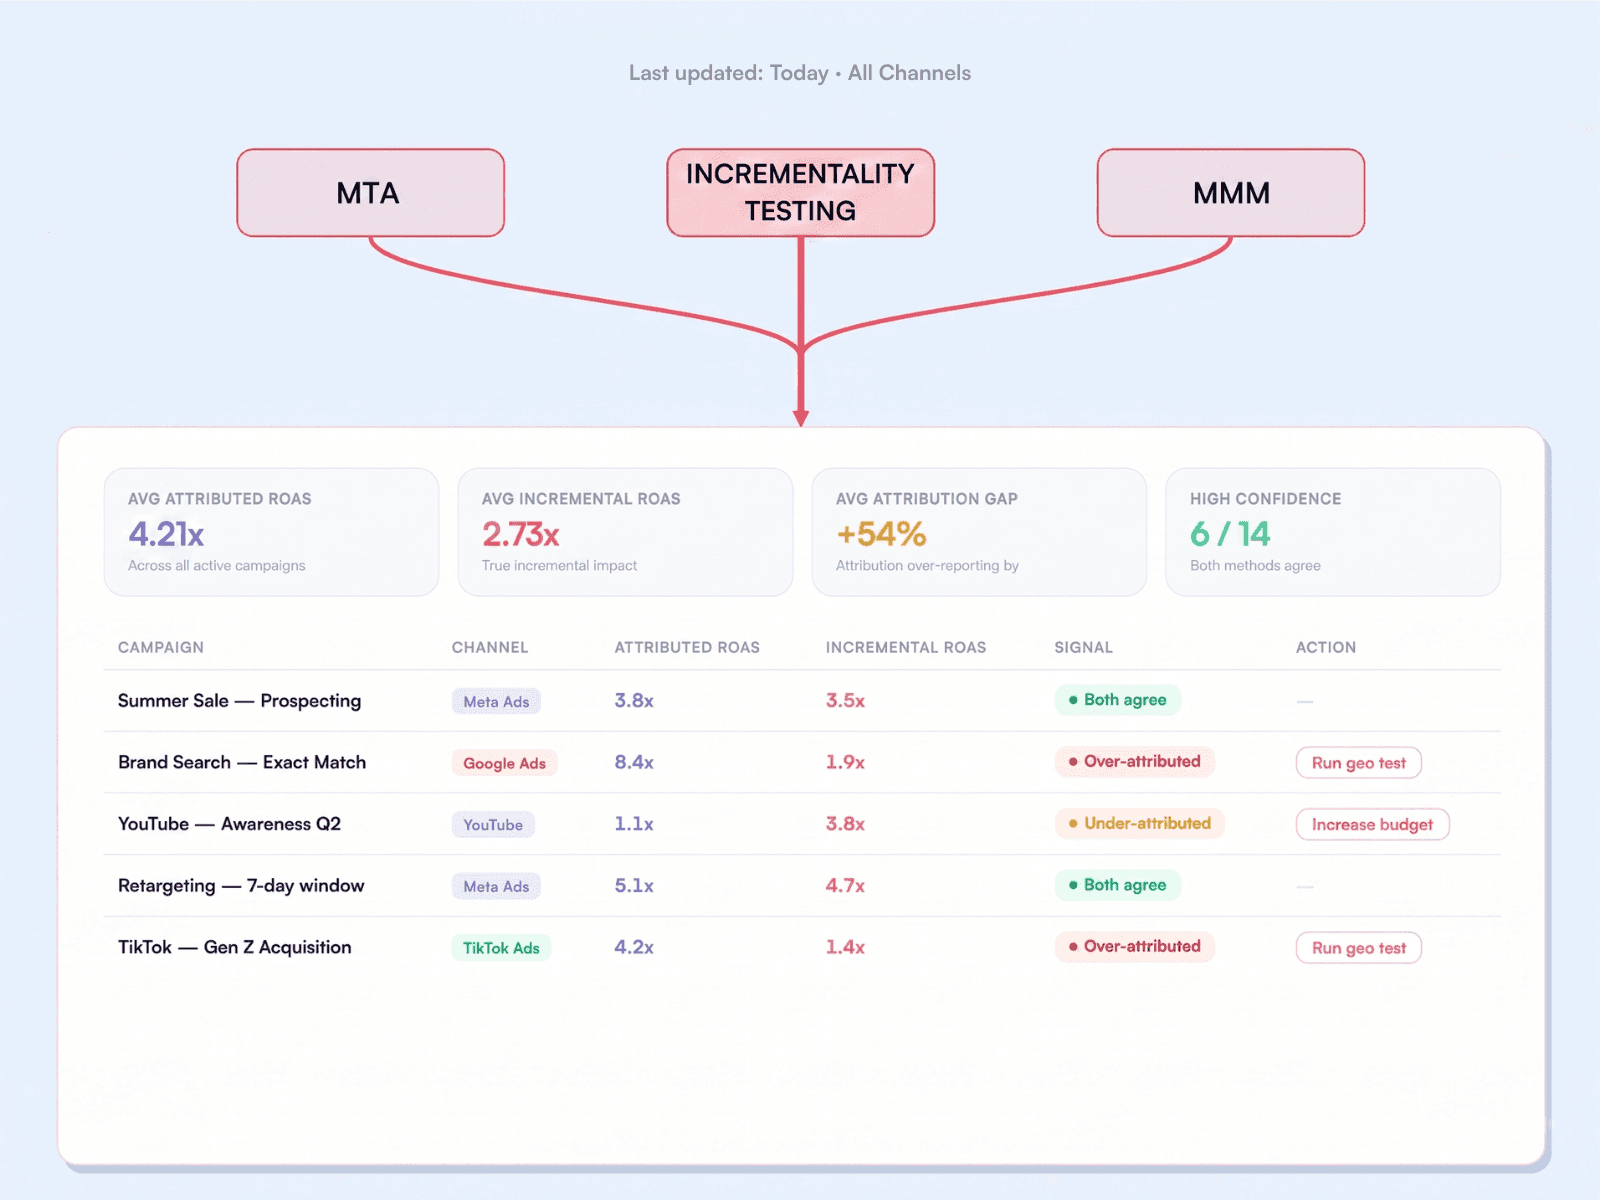
Platform numbers next to measured impact, campaign by campaign. When they disagree, Cassandra tells you what to change and can apply it for you.
Dashboard combining MTA, incrementality testing and MMM into attributed and incremental ROAS per campaign

What platforms claim vs what really happened.

What platforms claim vs what really happened.

What platforms claim vs what really happened.

Campaign by campaign, with the move to make.

Campaign by campaign, with the move to make.

Revenue by campaign, last 30 days

Example

Meta prospecting

Meta prospecting

€140k

€118k

Keep

Google brand search

Google brand search

€62k

€9k

Cut €16k

TikTok

TikTok

€40k

€54k

Scale

Influencers

Influencers

€20k

€31k

Scale

Platform says

Measured by Cassandra


Every measurement
in one place

Attribution says one thing. Incrementality says another. You're left reconciling them in a spreadsheet.

One calibrated view that merges attribution and incrementality.
You measure what your marketing actually drove.

Bar chart comparing reported and incremental marketing performance

How it works

Platform ROAS next to the real return

See exactly where attribution overstates or understates your real marketing impact.
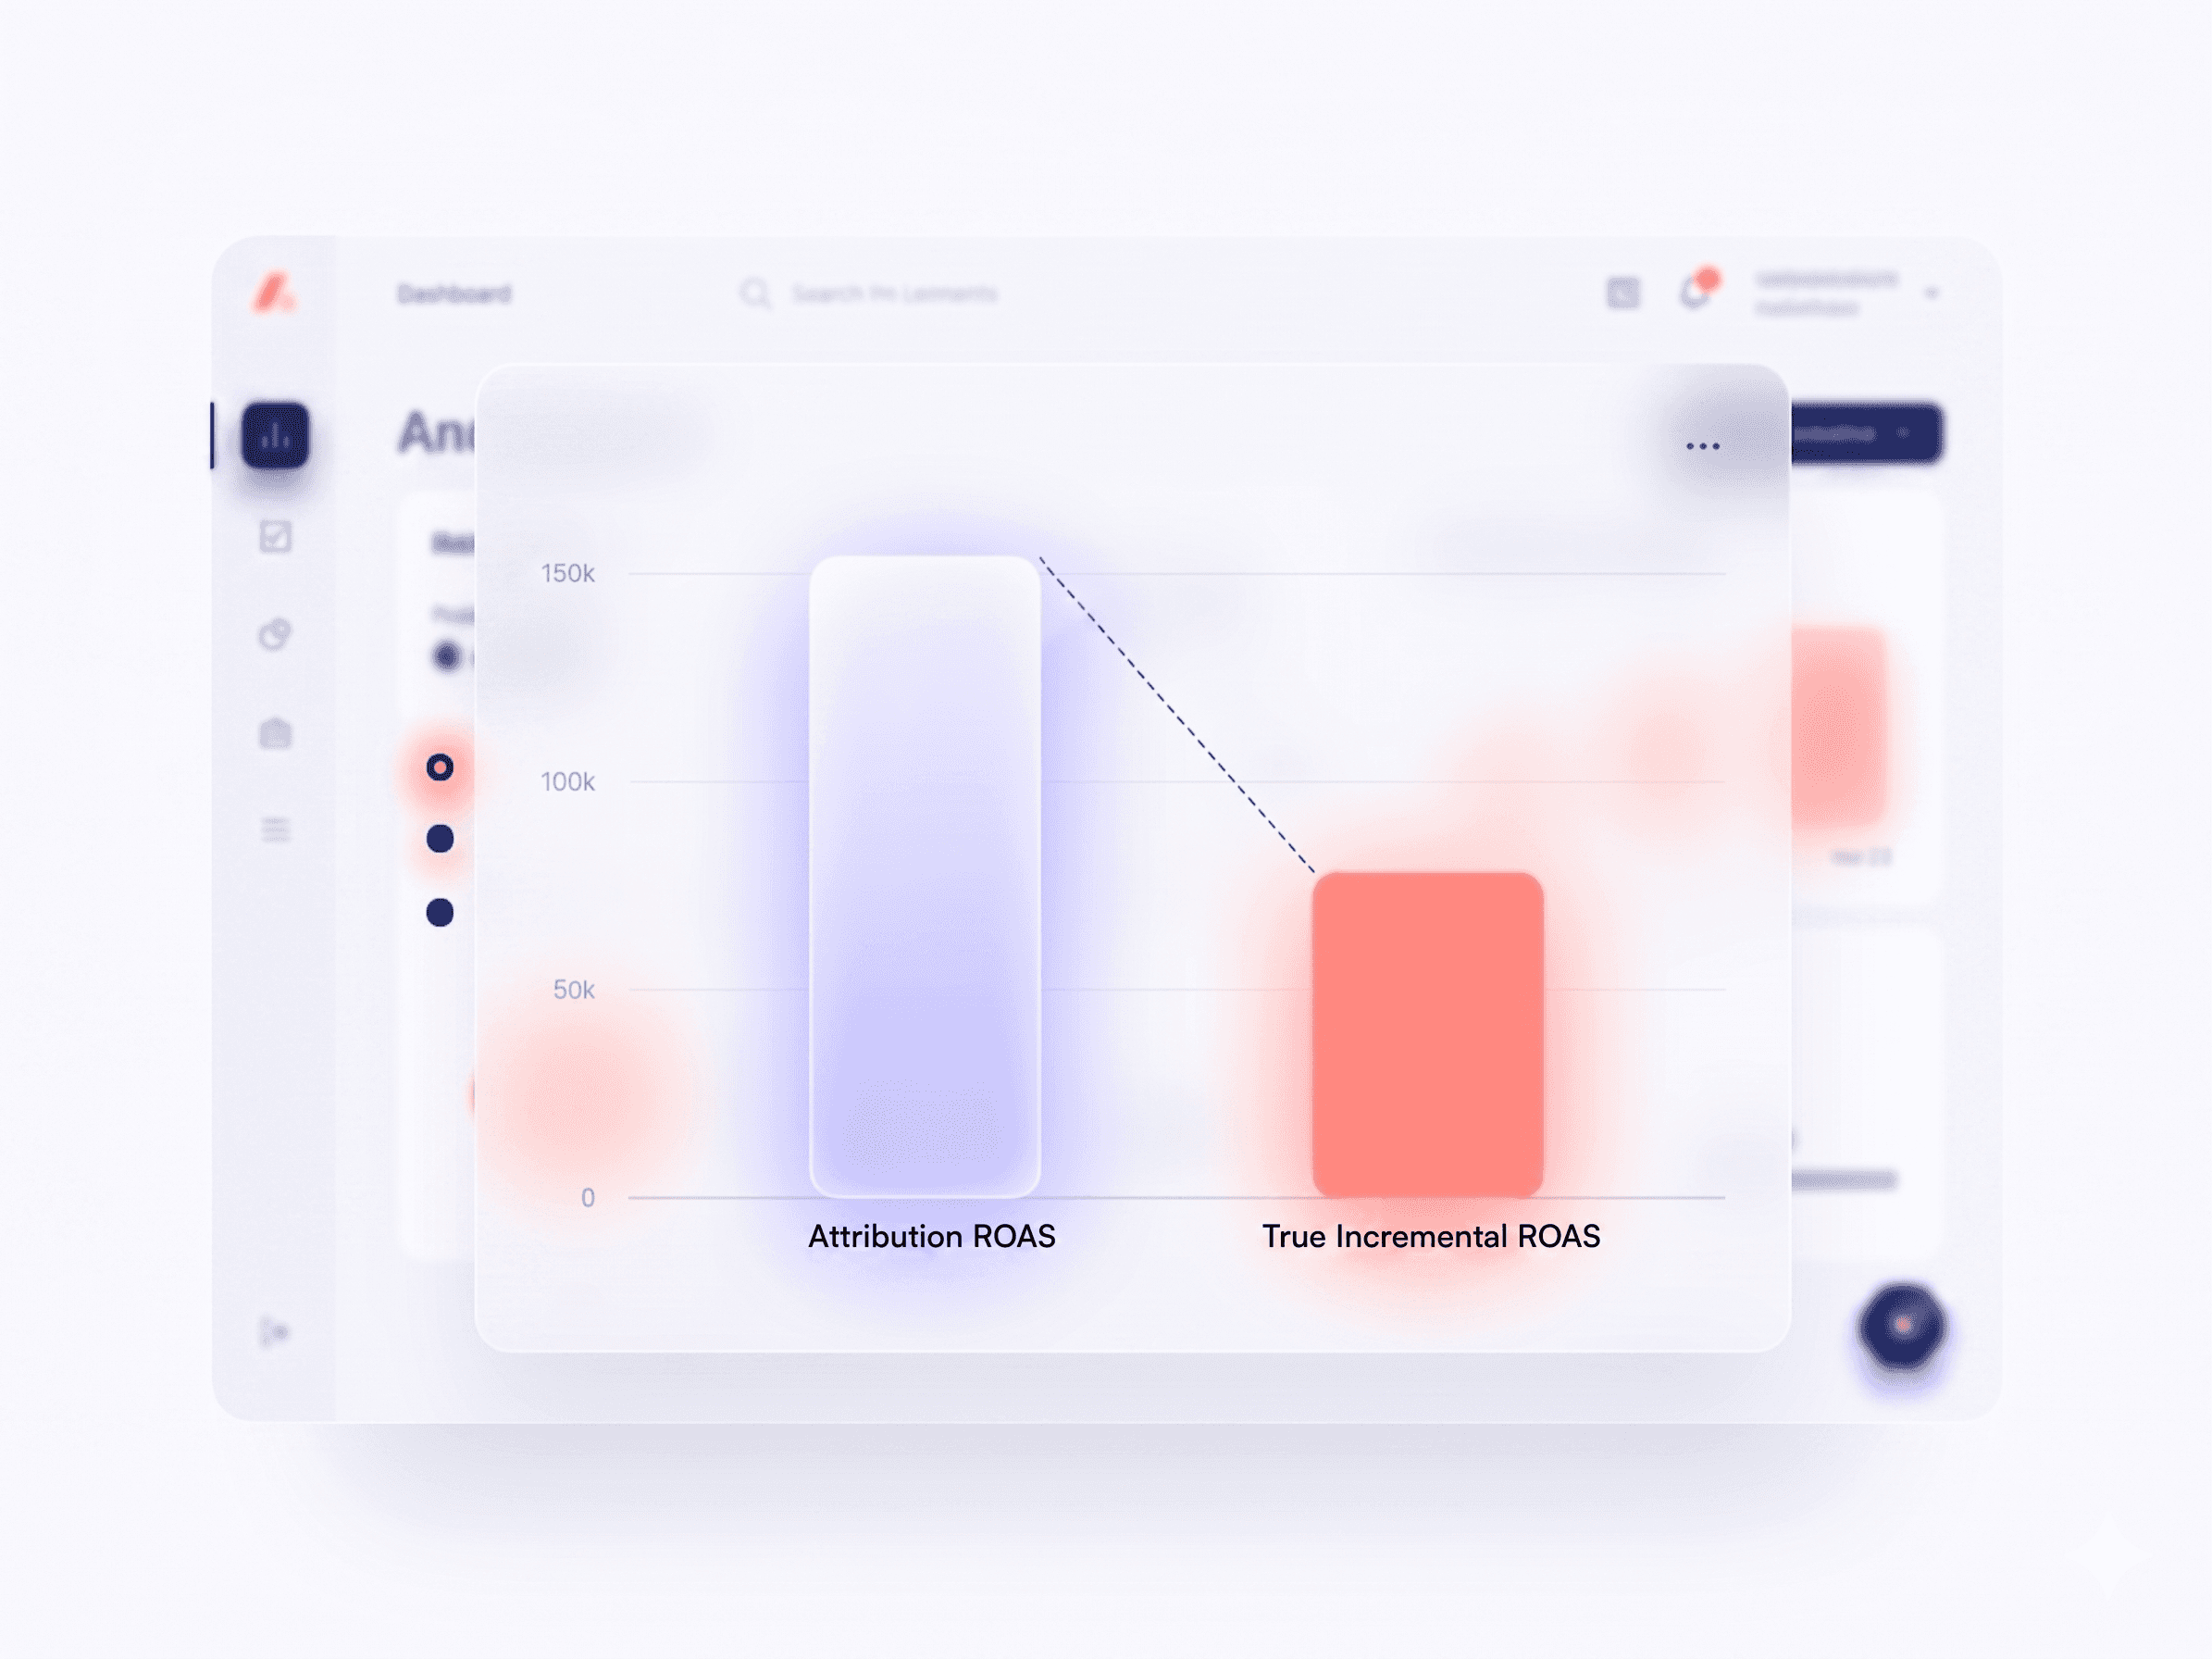
Dashboard comparing attribution ROAS with true incremental ROAS
Cassandra performance dashboard showing incremental results by channel

The real lift of every campaign,
channel by channel

Measure incremental lift at campaign granularity.
Filter by channel, compare across your full media mix.

A clear next move for every campaign

Models refresh automatically every day.
When the evidence changes, Cassandra proposes the budget move and can apply it, within your rules.

Cassandra dashboard chart showing incremental ROAS updated daily

Read performance in context.

Read performance in context.

See platform numbers next to the model and test results.

Compare the plan with the result.

Compare the plan with the result.

Keep the forecast, the actual outcome and the measurement window together.

From the dashboard to an implemented change.

From the dashboard to an implemented change.

From the dashboard to an implemented change.

Use performance and incrementality evidence to prepare the next budget move. Cassandra implements supported changes within your workspace permissions, then checks the result against the saved prediction.

Available actions depend on your connected workspace and permissions.

See how the result is checked →

Example execution

Illustrative

Budget plan prepared

Prepared

Required approval received

Approved

Supported budget change applied

Implemented

Confirm the scope and permissions. Request approval where your workspace rules require it.

Compare the observed result with the saved prediction. Keep supported findings and open questions for the next decision.


Built for your industry

“For the first time, we can clearly see the incrementality of each channel and reallocate budget in real time.”
Ecommerce & Retail

Used by PhotoSi, Velasca, North Sails, Home24, SkinLabo, and Victoria Beckham Beauty to plan media and measure incremental sales.

B2B
Education
Fintech
Charity

Built for your industry

“For the first time, we can clearly see the incrementality of each channel and reallocate budget in real time.”

Ecommerce & Retail

B2B

Education

Fintech

Charity

Built for your industry

“For the first time, we can clearly see the incrementality of each channel and reallocate budget in real time.”
Ecommerce & Retail

Used by PhotoSi, Velasca, North Sails, Home24, SkinLabo, and Victoria Beckham Beauty to plan media and measure incremental sales.

B2B
Education
Fintech
Charity