blog
/
research
Google Ads Benchmarks 2026 — Not From Platform Attribution
Google Ads benchmarks built on incremental ROI, not platform attribution. 253 MMM models, 59 advertisers, $383M in spend across 7 campaign types.


Get a weekly dose of insightful people strategy content
Google Ads Benchmarks 2026: What $383M in Spend Actually Returns
Key Findings: Google Ads ROI Benchmarks by Campaign Type and Vertical
Every Google Ads benchmark you've seen was built on platform data. Platform data has a structural problem: Google measures what Google wants to measure using last-click attribution.
This report is different. We analyzed 253 Marketing Mix Models across 59 advertisers — covering $383M in total media spend — to measure the actual incremental ROI of each Google Ads campaign type, isolated from cross-channel halo effects, seasonality, and attribution overlap.
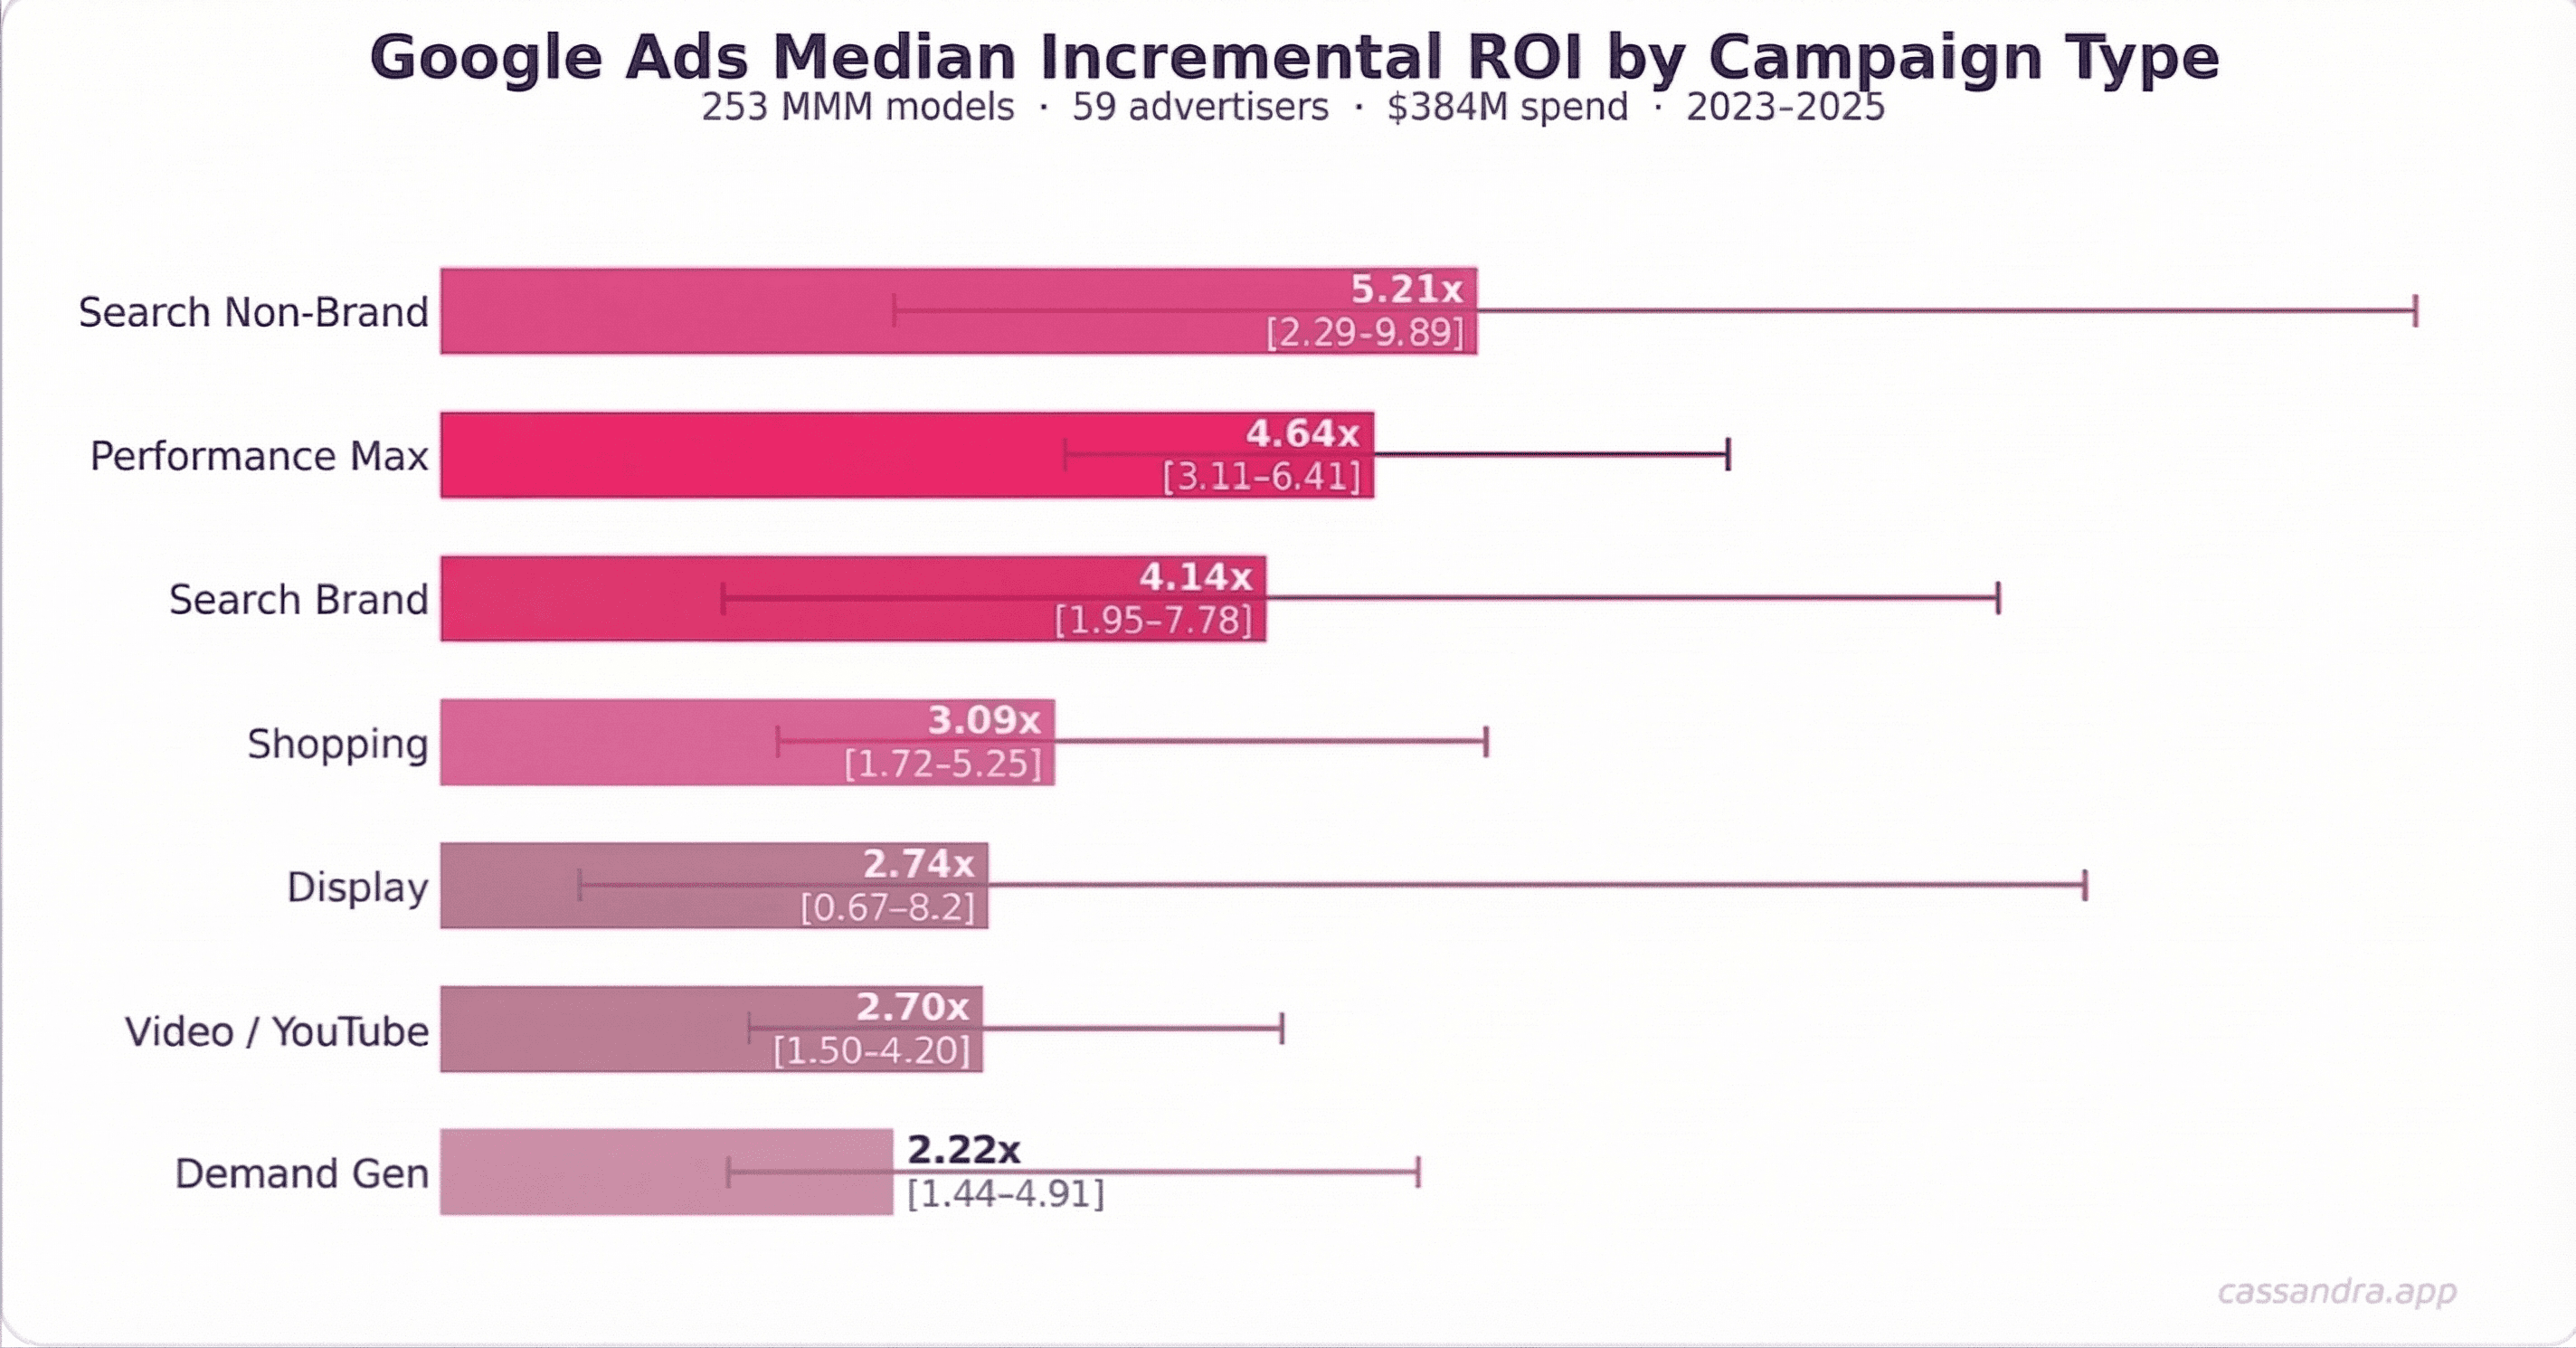
According to this analysis, the median incremental ROI for Google Search Non-Brand campaigns is 5.21x, while Performance Max delivers 4.64x and Search Brand sits at 4.14x. These numbers are systematically lower than platform-reported ROAS — by a factor of 2 to 5x — because they measure what your spend actually caused, not what Google attributed to it.
Key findings:
Search Non-Brand has a median ROI of 5.21x
Search Brand delivers a median incremental ROI of 4.14x across all sectors
Performance Max is the most consistent format at 4.64x — low risk.
Video / YouTube has a median ROI of 2.70x — competitive with Meta and TikTok Performance while reaching entirely different inventory. This is an underpriced channel
Demand Gen / Discovery shows a median of 2.22x with a confidence interval that requires scrutiny. Most advertisers should validate measurement methodology closely
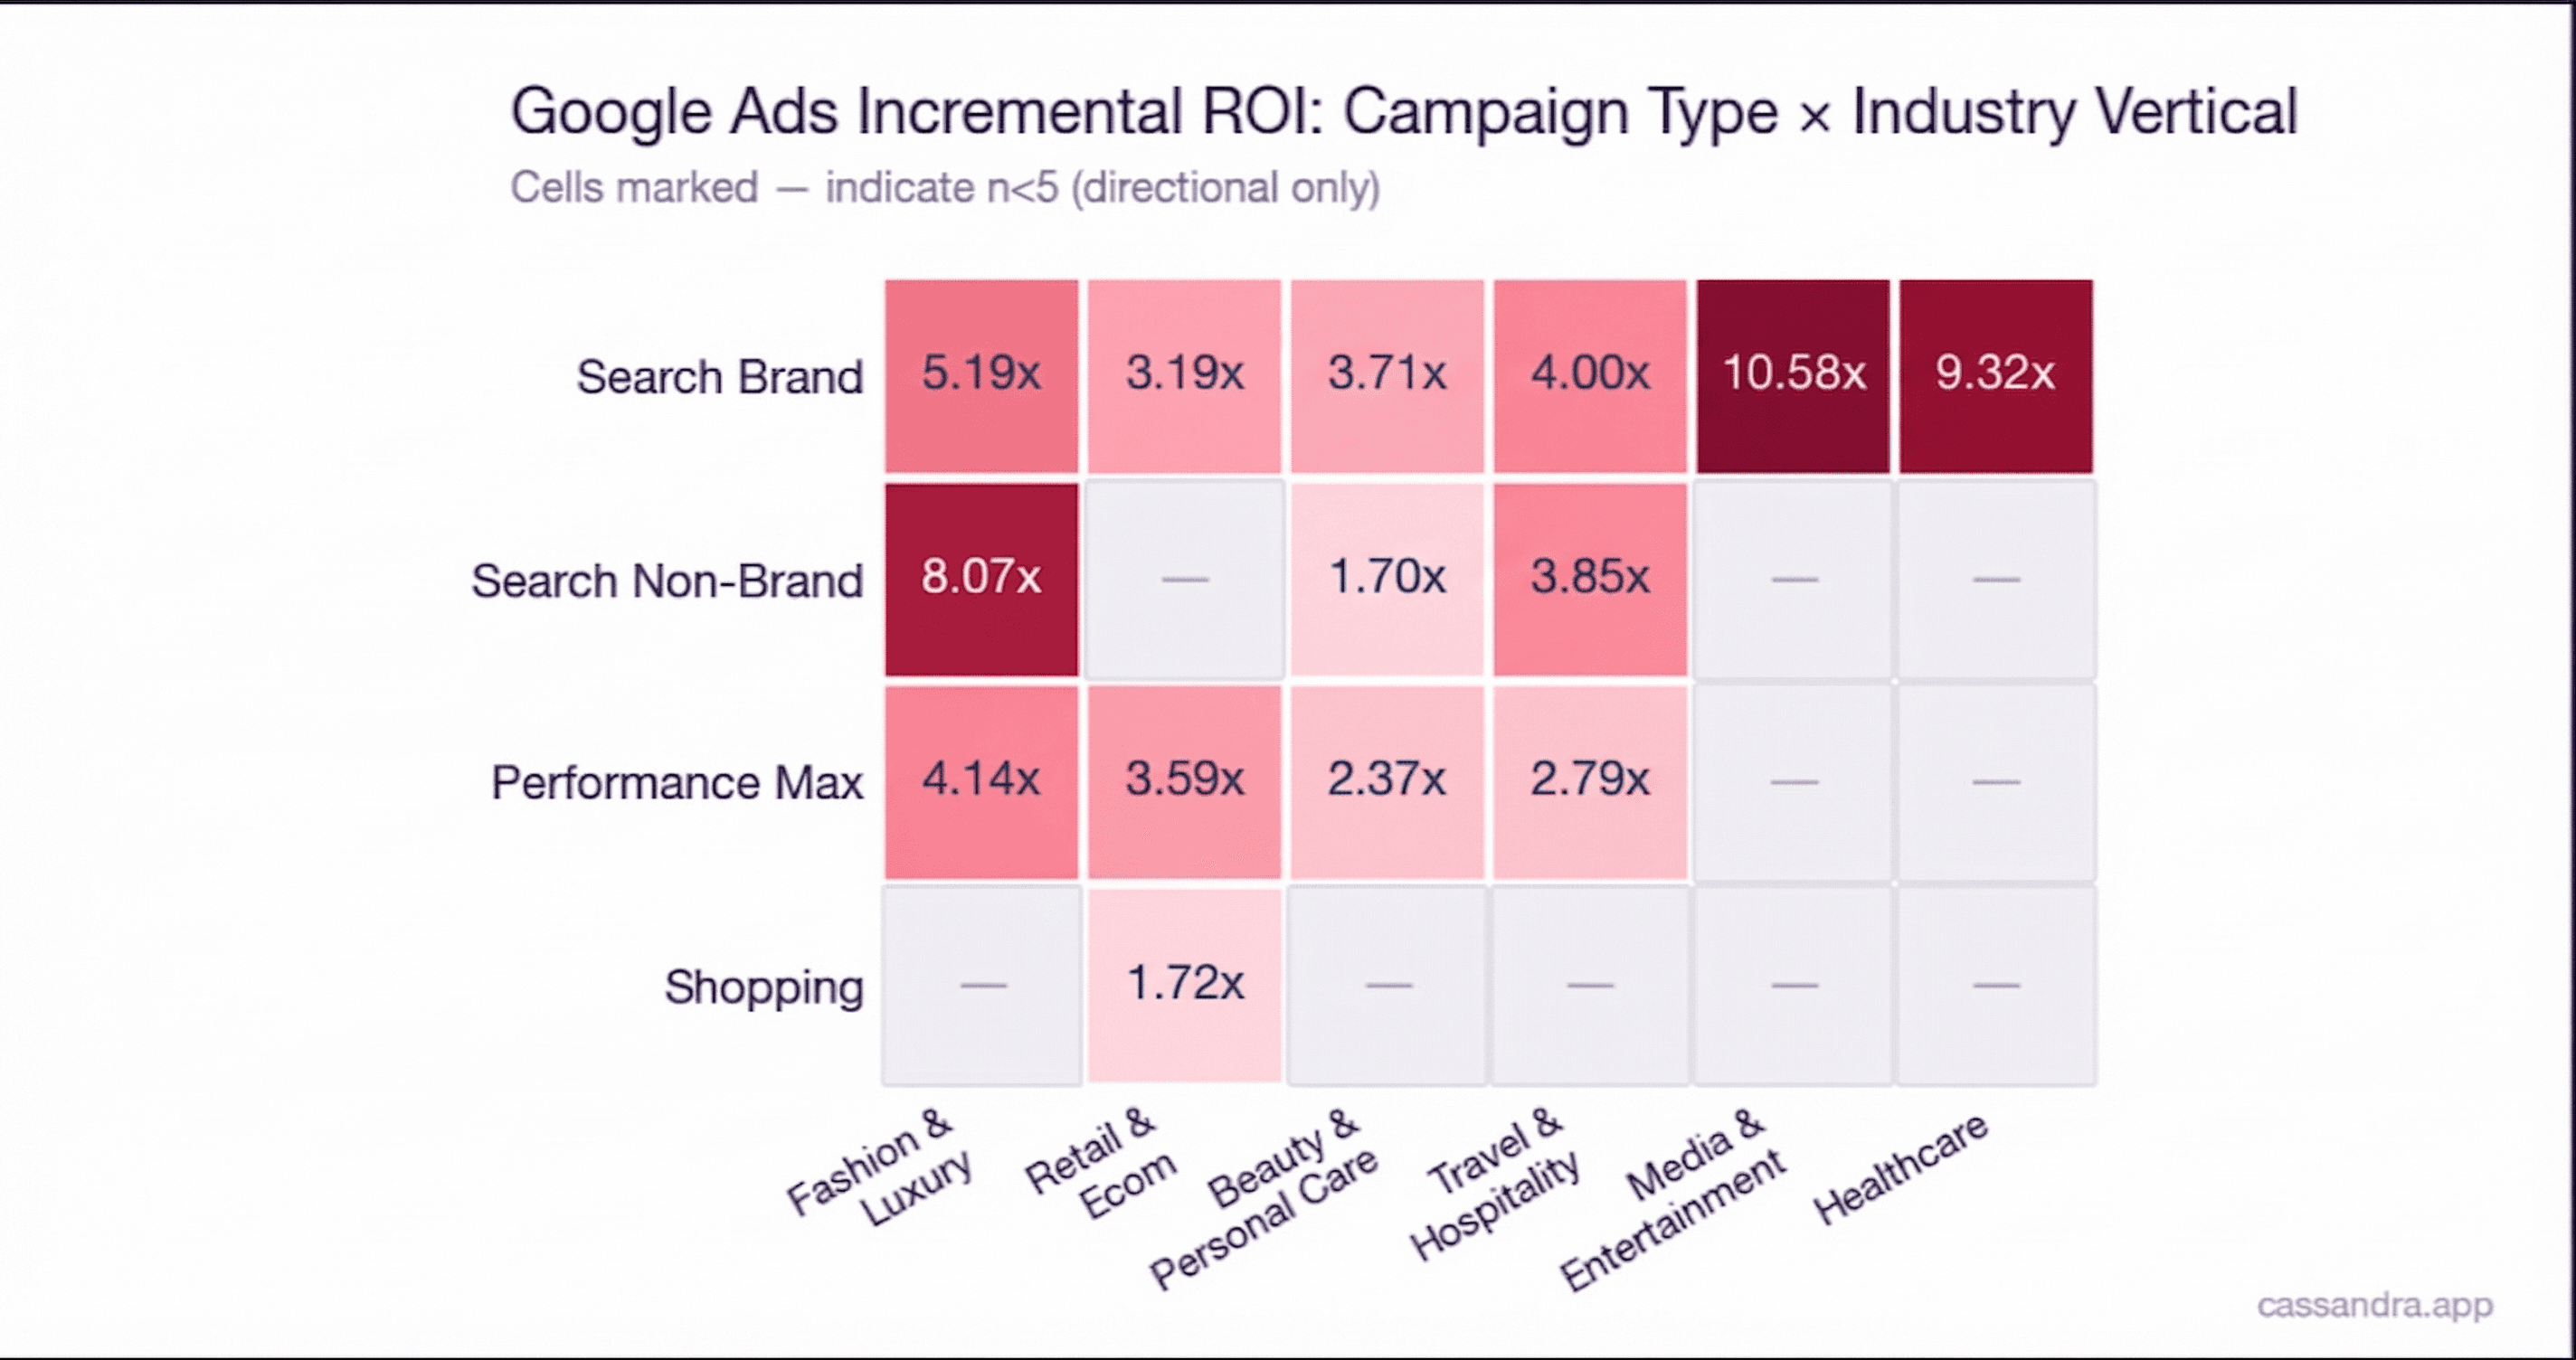
Vertical matters more than format: Media & Entertainment advertisers see a median Search Brand ROI of 10.92x. Retail & Ecommerce sees 3.19x on the same campaign type
Why Platform-Reported ROAS Is Not Incremental ROI
Google publishes average click-through rates, conversion rates, and cost-per-click benchmarks by industry. Some third-party tools publish average ROAS figures based on aggregated platform data. These numbers are everywhere. They are also nearly useless for budget decisions.
Here's why. Platform-reported ROAS is not incremental ROAS. When Google tells you your Search campaign delivered 12x ROAS, it is telling you that for every dollar you spent, users who clicked on your ad went on to generate 12x in attributed revenue. What it cannot tell you — and does not try to tell you — is how much of that revenue would have happened anyway. It cannot tell you how much was organic search that got intercepted by your own brand keyword. It cannot tell you how much was retargeting a user who would have converted in three days regardless.
The gap between platform-reported ROAS and true incremental ROI is not small. In our dataset, the average ratio between platform attribution and MMM-attributed outcomes varies by a factor of 2 to 5x depending on the channel. You may be paying for credit on revenue you were always going to get.
Marketing Mix Models, by contrast, measure incremental contribution. They isolate the marginal revenue generated by a dollar of spend after accounting for baseline, seasonality, organic trends, and the simultaneous effects of every other channel. This is not a perfect measurement — no measurement is — but it is structurally closer to the question that matters for budget decisions: what would I lose if I cut this channel?
That is the question these benchmarks answer.
Methodology: 253 MMM Models, 59 Advertisers, $383M in Spend
Dataset: 253 revenue-outcome MMM models from 59 unique advertisers, spanning 2023–2025. All spend and revenue values converted to USD at time-of-model exchange rates.
Campaign classification: Channel variable names were parsed and classified into seven campaign types — Search Brand, Search Non-Brand / Generic, Performance Max, Shopping, Display / GDN, Demand Gen / Discovery, and Video / YouTube — using consistent logic across all naming conventions. Each record represents one channel from one model run.
Vertical classification: Industry labels were backfilled for all records using marketer-facing vertical categories matched to client business models. Sporting sector excluded from the full dataset.
Statistics reported: For each campaign type, we report the P10–P75 ROI range, median ROI, and a 95% bootstrap confidence interval on the median (3,000 resamples). Records flagged as n<5 should be treated as directional only.
Google Ads Benchmarks by Campaign Type: Search, PMax, Shopping, Video, Display
Campaign Type | Models | Spend USD | Median ROI | CI 95% |
|---|---|---|---|---|
Search Brand | 85 | $87M | 4.14x | [1.95–7.78] |
Search Non-Brand | 60 | $95M | 5.21x | [2.29–9.89] |
Performance Max | 48 | $66M | 4.64x | [3.11–6.41] |
Shopping | 16 | $68M | 3.09x | [1.72–5.25] |
Video / YouTube | 14 | $3.6M | 2.70x | [1.50–4.20] |
Display | 15 | $37M | 2.74x | [0.67–8.2] |
Demand Gen | 15 | $27M | 2.22x | [1.44–4.91] |
Search Ads ROI: Brand vs Non-Brand Benchmarks
Search Brand and Search Non-Brand represent the two largest spend categories in our dataset — $87M and $95M respectively. Search captures demand that already exists. You are not creating intent; you are intercepting it.
What is worth noting is that:
Search Non-Brand delivers higher median ROI (5.21x vs 4.14x) because it captures category-level intent across a broader set of queries. Users searching for "houses in Stockholm" have high purchase intent but have not yet chosen a solution — the incremental value of appearing at that moment is significant.
Search Brand has a narrower spend ceiling — you cannot always spend more on your own brand name, while non-brand keywords offer near-unlimited scale (by increasing budget and keywords). This makes Non-Brand the higher-ROI and higher-scale format.
Confidence intervals are wider for Search Non-Brand — more variance in keyword quality, landing page relevance, and competitive auction dynamics create a wider range of outcomes.
Search Brand ROI reflects defensive value — the 4.14x median is driven primarily by revenue that would otherwise be captured by competitors bidding on your brand keyword.
In 95% of cases, investing in Search Brand campaigns in competitive markets yields between 1.95x and 7.78x incremental ROI — but total spend is capped by brand search volume and ROI in this activity depends strictly by how much your competitors are bidding on your brand keywords.
Performance Max Benchmarks: Consistent at 4.64x, low risk
Performance Max is Google's most aggressively pushed campaign format of the last three years. It automates creative, bidding, audience, and placement across all Google inventory. It is marketed as the future of performance advertising.
The data tells a more measured story.
At 4.64x median ROI, Performance Max performs well. It ranks second among Google campaign types, behind both Search Brand and Non-Brand. The 95% confidence interval of [3.11–6.41] shows that most advertisers can expect returns in this range, with limited upside compared to search formats.
What Performance Max does offer is consistency in the middle. Its confidence interval — [3.11–6.41] — is tighter than Display/GDN and Non-Brand Search. You are less likely to hit the extremes. This makes it a reasonable default for advertisers who want predictable performance without the complexity of managing separate search, shopping, and display campaigns.
The concern is opacity. PMax allocates budget across inventory without telling you where it's going. Our data includes $66M in PMax spend, and in most cases the advertisers themselves could not decompose what portion was search, shopping, display, or YouTube. You are buying a bundle and trusting Google's algorithm to optimize within it.
Performance Max at 4.64x median is a reasonable baseline expectation. If your PMax ROAS is significantly higher than this, verify whether your measurement methodology is capturing true incrementality or platform-attributed conversions. The two often diverge substantially on automation-heavy formats.
Want to know your PMax incremental ROI? A calibrated Marketing Mix Model isolates PMax's true contribution from the bundle. See how it works.
YouTube Ads ROI: The Most Underpriced Channel in Google's Portfolio
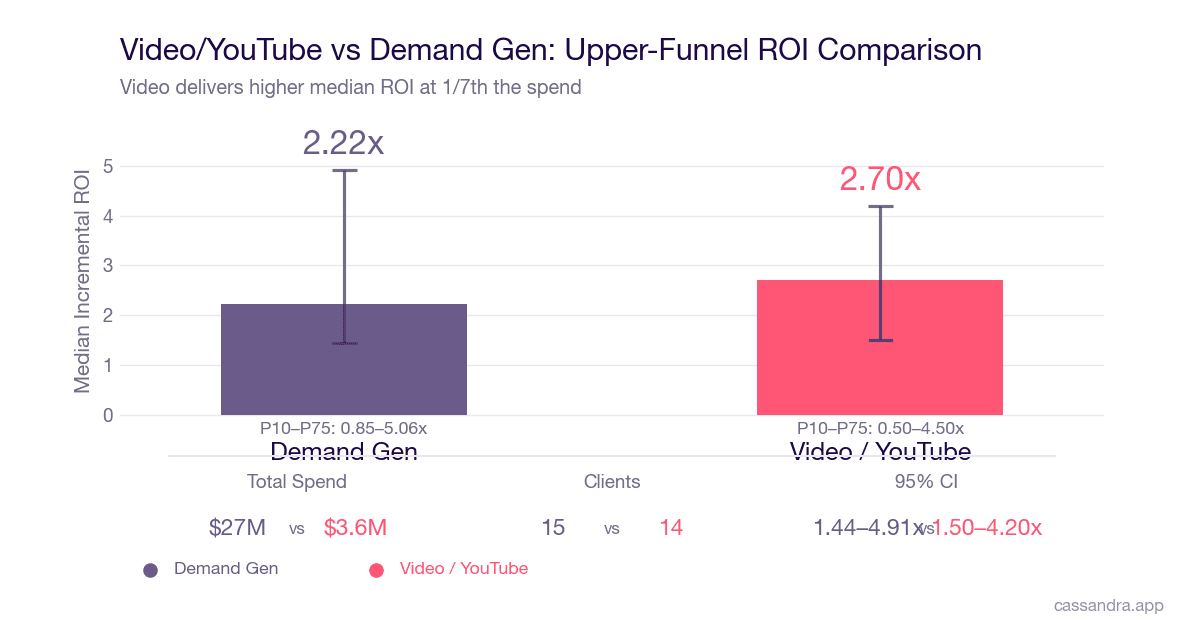
Metric | Demand Gen / Discovery | Video / YouTube |
|---|---|---|
Clients | 15 | 14 |
Models | 15 | 14 |
Total Spend (USD) | $27M | $3.6M |
Median ROI | 2.22x | 2.70x |
95% CI (median) | [1.44–4.91] | [1.50–4.20] |
P10 | 0.85x | 0.50x |
P75 | 5.06x | 4.50x |
This is the finding that most media plans have wrong — in the wrong direction.
Video / YouTube has a median incremental ROI of 2.70x. That makes it competitive with Meta and TikTok Performance advertising while reaching entirely different inventory, different audiences at different stages of attention, and different creative contexts. The brands not allocating to YouTube are not being efficient. They are leaving cheap reach on the table.
The structural case for Video is upper-funnel economics. CPM costs on YouTube are significantly lower than on Search for equivalent audience quality. You are reaching users earlier in the decision journey — before the competitor's brand keyword ad, before the shopping comparison, before the price negotiation. Brands that invest early in Video build brand equity that compounds into Search Brand ROI. The brands seeing 10x+ on Search Brand in this dataset are not getting there by accident. They built the brand before they captured the demand.
At 2.70x, Video's median incremental ROI is lower than Search — that is expected and correct for an upper-funnel channel. The relevant comparison is not "is this better than Search Brand?" It is "what is this reach (expansion) worth relative to its cost?" The answer, at current YouTube CPMs, is: more than most advertisers are pricing it.
YouTube's relative underinvestment also means the competitive auction is less saturated than Search. You are buying reach in a channel where the floor price is low, the audience quality is high, and most of your competitors have not shown up yet. That asymmetry does not last forever.
Opportunity: The 95% confidence interval on Video/YouTube spans [1.50–4.20], meaning the better half of advertisers are seeing returns at or above 2.70x — competitive with Performance Max's median of 4.64x. These are advertisers with strong creative, clear brand positioning, and measurement frameworks that account for delayed brand-to-purchase attribution. The gap between the median (2.70x) and the upper end of the confidence interval (4.20x) is not random — it is the difference between treating YouTube as a direct-response channel and treating it as what it actually is: the cheapest reach available at scale in 2025.
Because of the lower spend volume on youtube compared to other channels: 3.6M vs +30M, take this assessment with a grain of salt.
Video and Demand Gen belong in your media plan as upper-funnel investments. Measure them using incrementality measurements against a financial metric. Brands ignoring YouTube aren't being rigorous. They're being reactive. The brands building equity there now will see their Search Brand ROI outperform this dataset's median in three years.
Google Ads Benchmarks by Industry: Why Vertical Matters More Than Format
The aggregate benchmarks matter. But they obscure the most important finding in this dataset: where you operate determines what Google can deliver for you.
Fashion & Luxury vs Retail & Ecommerce: Two Different Stories
Fashion & Luxury and Retail & Ecommerce are both retail-adjacent — but they play differently on Google.
Campaign Type | Fashion & Luxury | Retail & Ecommerce | All Verticals |
|---|---|---|---|
Search Brand | 5.19x | 3.19x | 4.14x |
Search Non-Brand | 8.07x | — | 5.21x |
Performance Max | 4.14x | 4.00x | 4.64x |
Shopping | — | 2.96x | 3.09x |
Fashion & Luxury sees exceptional Search ROI — brand (5.19x) and non-brand (8.07x) — because these advertisers are competing on desirability, not price. When a user searches for a specific luxury brand, the intent is high and the competitive alternatives are limited. Non-brand search in Fashion & Luxury captures aspirational queries that convert at high margins.
Retail & Ecommerce tells a different story. Search Brand sits at 3.19x — below the all-vertical median — because retail brands frequently have high organic presence. Shopping (2.96x) and PMax (4.00x) hold up better as product-intent channels. For Retail & Ecommerce advertisers, the portfolio should skew toward Shopping and PMax rather than brand search alone.
Beauty & Personal Care: Brand Search Leads at 3.71x
Campaign Type | Beauty & Personal Care (Median ROI) |
|---|---|
Search Brand | 3.71x |
Search Non-Brand | 1.70x |
Performance Max | 2.37x |
Beauty & Personal Care shows a distinct pattern in this dataset. Search Brand leads at 3.71x — below the all-vertical median (4.14x) — while Search Non-Brand sits at 1.70x, with a wide confidence interval [0.01–15.53] that reflects high variance across advertisers. The typical beauty brand sees modest incremental returns from non-brand search; a small number of outliers see exceptional results. Do not use the Non-Brand median as a planning assumption without validating your own incrementality first.
PMax at 2.37x falls between Brand and Non-Brand. For Beauty & Personal Care advertisers, Search Brand is the highest-ROI and most reliable format. PMax can extend reach, but should be validated against Brand Search before receiving significant incremental budget.
Travel & Hospitality: The Most Balanced Google Ads Portfolio
Campaign Type | Travel & Hospitality (Median ROI) |
|---|---|
Search Brand | 4.00x |
Search Non-Brand | 3.85x |
Performance Max | 2.79x |
Travel & Hospitality presents the most balanced vertical in this dataset. The spread between campaign types is relatively narrow, suggesting that Google's full portfolio — brand search, non-brand, and PMax — all contribute meaningfully. The lower Search Brand ROI (4.00x) compared to Media & Entertainment or Healthcare reflects the higher competitive intensity and longer consideration cycles in travel.
Google Ads ROI Benchmarks by Vertical: Summary Table
Campaign Type | Fashion & Luxury | Retail & Ecom | Beauty & Personal Care | Travel & Hospitality | Media & Entertainment | Healthcare |
|---|---|---|---|---|---|---|
Search Brand | 5.19x | 3.19x | 3.71x | 4.00x | 10.58x | 9.32x |
Search Non-Brand | 8.07x | — | 1.70x | 3.85x | — | — |
Performance Max | 4.14x | 4.00x | 2.37x | 2.79x | — | — |
Shopping | — | 1.72x | — | — | — | — |
Cells marked — indicate insufficient sample size (n<5) for reliable median estimation. Treat as directional only.
How to Use These Google Ads Benchmarks for Budget Decisions
These numbers are not targets. They are reference points for asking better questions.
1. Audit your channel ROI against vertical-appropriate benchmarks, not all-vertical averages. If you are a Retail & Ecommerce advertiser with Search Brand ROI of 3.0x, you are near the vertical median (3.19x) — not underperforming. If you are in Healthcare with Search Brand at 3.0x, you are significantly below median (9.32x). The same number tells a different story in each context.
2. Invest in Video before your competitors do. At 2.70x median ROI, Video / YouTube is competitive on an incremental basis and structurally underpriced relative to Search. CPM costs are lower, competition is lighter, and the brand equity built through Video compounds into higher Search Brand ROI over time. The window where YouTube is the cheaper channel does not stay open indefinitely.
3. Distinguish Performance Max from Performance Max. A PMax campaign in Retail & Ecommerce has a median of 3.59x. Healthcare PMax data has insufficient sample size for benchmarking — treat directionally only. Google's automation does not know your vertical's economics. It optimizes for conversion volume within the signals you give it. Set vertical expectations accordingly.
4. Treat these ranges as confidence intervals, not point estimates. The P10–P75 range for Search Non-Brand spans 0.06x to 11.93x. The same campaign type, in the same vertical, can deliver near-zero or exceptional returns depending on execution, competitive dynamics, and landing page quality. The median tells you the central tendency; the range tells you the stakes.
5. Use MMM, not platform attribution, to evaluate these formats. Every benchmark in this report is MMM-attributed. Platform attribution will return systematically higher numbers — especially for Search Brand (where organic intercept is common) and Video (where view-through windows inflate credit). If you are evaluating campaign ROI against platform ROAS alone, you are comparing against a different dataset. A calibrated Marketing Mix Model is the only methodology that isolates incremental contribution cleanly enough to use for budget allocation decisions. Search Brand's gap between platform ROAS and incremental ROI (4.14x) is often the widest of any format — because platforms over-credit conversions that would have happened organically.
Google Ads Benchmarks FAQ
Why should I still invest in Search Brand if Non-Brand has higher ROI?
Defensive necessity. If you don't bid on your own brand keywords, competitors will — and they do. When a competitor bids on your brand name, they intercept users who already intended to buy from you. A user typing your brand name into Google has already completed the consideration and decision stages. Not investing in brand search doesn't save budget; it hands revenue to competitors. The 4.14x median is lower than Non-Brand (5.21x), but Search Brand serves a different function: it protects revenue you have already earned through brand building. The ROI floor is high (P10 = 1.31x — still positive) and the spend ceiling is low (limited by brand search volume), making it a low-risk, defensive allocation.
Why is Search Brand ROI sometimes lower (P10 = 1.31x)?
Several factors can drive lower incremental ROI from Search Brand campaigns. The most common is organic cannibalization: users who search your brand name would have clicked the organic result below your paid ad if the ad weren't there. In high-organic-share categories, brand keyword spend captures revenue that was never at risk of being lost. MMMs that properly account for organic baseline will assign lower incremental value to brand search in these cases. This is not a failure of the channel — it is accurate measurement. Even at P10, the 1.31x floor is positive.
Should I always prioritize Search over Performance Max?
Not necessarily. The comparison depends on scale and objectives. Search requires active keyword management and is limited by query volume. PMax can reach demand that Search cannot access, and at 4.64x median ROI it delivers positive returns. The right portfolio typically uses Search for high-intent, high-value queries and PMax to extend reach where explicit keyword targeting is impractical.
Why do Media & Entertainment and Healthcare have such high ROI across all formats?
Two structural factors: customer lifetime value and search intent quality. In both verticals, the revenue per conversion is typically high (subscriptions, healthcare services) and the search queries are high-intent (people in active decision mode). Google Ads has higher incremental value when it intercepts qualified, high-intent demand. Lower-ticket, lower-intent categories naturally see lower incremental returns from the same investment.
Is 2.70x a good ROI for Video / YouTube?
Yes — when you account for what Video is actually doing. Video is an upper-funnel channel. The 2.70x median represents MMM-attributed incremental revenue, which means it is already accounting for the delayed and indirect nature of brand-building impact. At 2.70x, Video is competitive with Meta and TikTok Performance advertising on an incremental basis, while reaching different audiences at different points in the funnel. The additional case for Video is brand equity compounding: advertisers who invest in YouTube now are building the brand presence that drives higher Search Brand ROI later. The 2.70x underestimates the full-funnel value.
Are Google Ads worth it in 2026?
According to this dataset, every Google Ads campaign type analyzed delivers a positive median incremental ROI — from Demand Gen at the lower end (2.22x) to Search Non-Brand at 5.21x. The question is not whether Google Ads are worth it, but which campaign types deliver the highest incremental return for your specific vertical. A Healthcare advertiser sees 9.32x on Search Brand. A Retail & Ecommerce advertiser sees 3.19x on the same format. The channel works; the returns vary by 3–4x depending on what you sell and how you measure.
What is a good conversion rate for Google Ads?
This report does not cover conversion rate benchmarks — intentionally. Conversion rates measure platform-reported efficiency (clicks to conversions), not incremental business impact. A campaign with a high conversion rate can still have low incremental ROI if it is converting users who would have purchased organically. The more useful question is: what is your incremental ROI per dollar of spend? That is what these benchmarks provide. For platform-level conversion rate benchmarks by industry, third-party tools like WordStream and LocalIQ publish annual reports — but interpret them alongside incrementality data.
How reliable are the vertical-level findings given the sample sizes?
Robustness varies by vertical. Fashion & Luxury, Retail & Ecommerce, and Beauty & Personal Care have sufficient sample sizes for reliable conclusions. Media & Entertainment and Healthcare are directionally strong but should be treated with wider confidence intervals given smaller client counts. Any campaign type showing n<5 in the detailed tables should be considered directional only.
Can I use these benchmarks to set budget allocation targets?
Use them as starting points, not conclusions. A benchmark tells you the central tendency of a distribution; your business operates at a specific point within that distribution. Set your own MMM baseline first. Then use these benchmarks to identify where your numbers diverge meaningfully from vertical medians — those divergences are where the most important questions live.
What is a Marketing Mix Model and why does it matter for benchmarks?
A Marketing Mix Model (MMM) is a statistical model that measures the incremental revenue contribution of each marketing channel — isolating the effect of one channel from all others, from seasonality, and from organic baseline. Unlike platform attribution (which counts clicks and assigns credit), MMM answers: "what revenue would I lose if I turned this channel off?" Every benchmark in this report is MMM-attributed, making these the first Google Ads benchmarks built on causal measurement rather than correlation.
The Benchmark Problem — And What Comes Next
The media measurement industry has a benchmark problem. The benchmarks that circulate most widely — platform ROAS averages, industry CTR reports — are built on data that conflates incrementality with attribution. They measure what happened. They do not measure what your spending caused.
This report attempts a different standard. Two hundred and fifty-three Marketing Mix Models. Fifty-nine advertisers. Three hundred and eighty-three million dollars in analyzed spend. The picture that emerges is more nuanced than the platform-facing benchmarks suggest — and in some places, more optimistic.
Search works — both brand and non-brand — across virtually every vertical we analyzed. The incremental evidence for search intent capture is robust. Search Non-Brand leads at 5.21x median, reflecting the high incremental value of capturing category-level intent. Search Brand at 4.14x serves a different but essential function: defending revenue against competitors who will bid on your brand if you don't. Performance Max delivers consistent middle-ground returns, with the important caveat that its opacity makes optimization difficult. Shopping holds up particularly well for retail categories.
Video and Demand Gen carry more nuance than the negative narrative suggests. At 2.70x median incremental ROI, YouTube is competitive with social performance channels while reaching entirely different inventory. CPM costs remain significantly below Search for equivalent audience quality. The brands ignoring YouTube are leaving cheap reach on the table — and ceding brand equity ground to competitors who are showing up there. The brands building presence on YouTube now are the ones whose Search Brand ROI will outperform this dataset's median in three years.
Vertical context changes everything. The same campaign type can be your highest-ROI channel or your biggest budget mistake depending on what you sell, who buys it, and how much intent precedes the purchase. No all-vertical benchmark survives contact with a vertical-specific business reality.
Use these numbers as anchors for better questions. Not as substitutes for measurement.
Author: Gabriele Franco, Founder & CEO of Cassandra
Data sourced from Cassandra's MMM benchmark dataset. Revenue models only. Sporting sector excluded. USD-standardized using time-of-model exchange rates. N=253 models, 59 advertisers, data period 2023–2025.
Measure Your Own Incremental ROI
These benchmarks show what the market looks like. The next question is: where does your portfolio sit?
Cassandra is a Marketing Mix Modeling platform that helps growth teams measure and optimize the incremental impact of their media spend. If you want to know your actual incremental ROI by channel — not platform-attributed ROAS — book a demo or start a free trial.