blog
/
research
Why Google and Meta's Conversion Lift Calibration Fails at Scale
Google's Modern Measurement Playbook assumes the incrementality ratio never changes. We demonstrate that this approximation too simplistic — and we show what to do instead.


Get a weekly dose of insightful people strategy content
The Promise
Attribution platforms gave you granularity. Marketing Mix Modeling gave you truth. For years, the two lived in separate worlds, updated on different cadences, serving different stakeholders.
Then a practical shortcut emerged.
Run an incrementality lift test. Measure the ratio of true incremental conversions to platform-attributed conversions — call it k. Now apply that ratio to your daily attribution reports. You have daily incrementality without running a new experiment every day. Cheap. Scalable. Operationally simple.
Meta formalized this as their Calibration methodology, encouraging advertisers to use conversion lift results to correct platform-reported ROAS. Google pushed incrementality experiments as a tool for calculating correction factors to apply to attribution at scale. Think with Google published guidance on how marketers should "get a grip on incrementality" by using this approach. Industry analysts, agencies, and measurement vendors adopted the framework. It became standard practice.
One test. One number. Calculate the incrementality multiplier. Apply it to daily attributions to get daily icnrementality measurmenet.
It's wrong.
The Assumption That Breaks
The incrementality multiplier rests on one assumption: the ratio of incremental revenue to attributed revenue is constant, regardless of spend level.
Written out:
Where k is fixed — measured once in a lift test, applied indefinitely. This assumes a linear relationship. Double your attributed revenue, and your incremental revenue doubles too. The ratio holds whether you're spending $10,000 a week or $500,000 a week.
That assumption is empirically false.
What the data actually shows
We analyzed 155 weeks of campaign attribution data alongside weekly MMM outputs for a European DTC brand, covering seven channels across Google and Meta, over $3M in monthly spend. For each channel, we modeled the relationship between platform-attributed revenue and true incremental contribution.
The result is not a straight line.
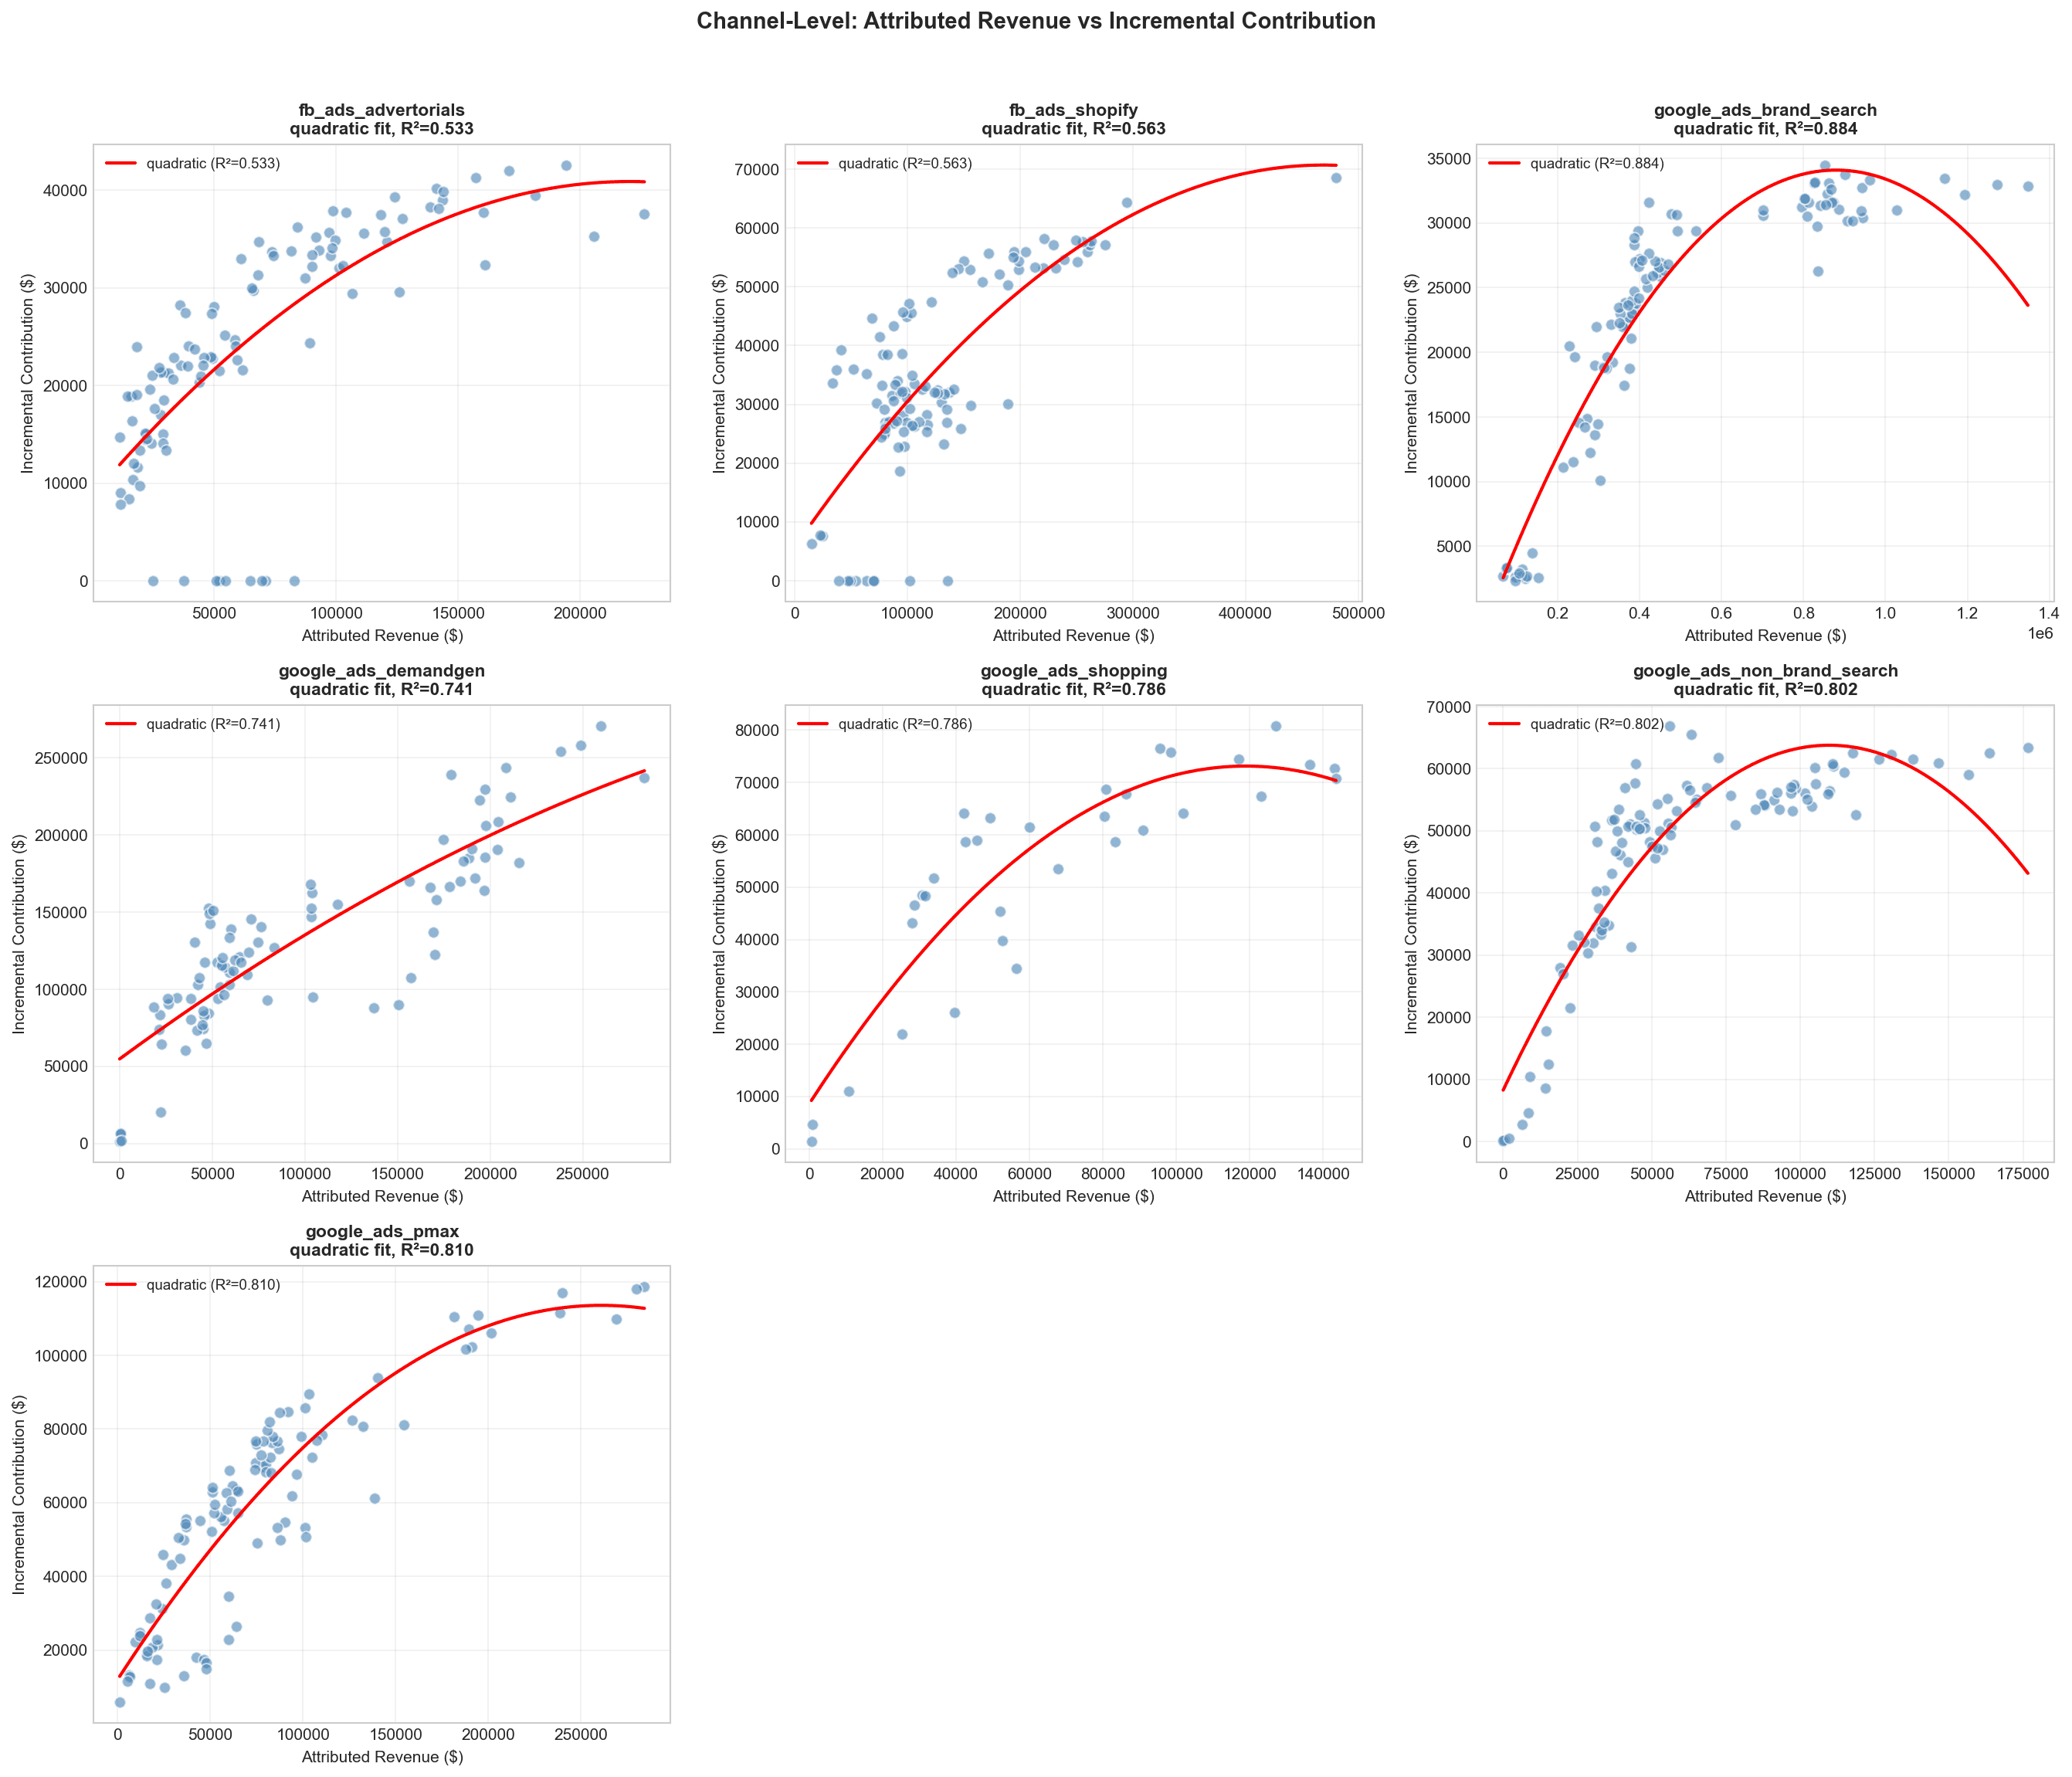
Every channel shows the same pattern: a concave, diminishing-returns curve. As attributed revenue grows, incremental contribution grows — but at a declining rate. R² values range from 0.53 to 0.88 across all channels. The multiplier k is not a constant. It shrinks as you spend more. At low spend, k ≈ 0.8. At high spend, the same channel may have k ≈ 0.3. Apply the wrong one and you're off by 2.5x.
Why This Happens: The Audience Overlap Effect
Attributions and incrementality are not linearly correlated, revealing the duplication of conversions attribution problem at high spend volumes.
At low spend: exclusive, high-intent audiences
When you spend modestly, your ads reach your most responsive audience — high-intent users unlikely to be simultaneously targeted by your campaigns on other platforms. Attribution is mostly honest. Platforms are attributing different people. Incrementality ratio is high.
At high spend: audience pools overlap, platforms stay siloed
As spend grows, you exhaust your core audience. Targeting broadens. You start reaching users who are also being reached by your other active channels.
Meta doesn't know about your Google campaigns. Google doesn't know about your Meta campaigns. Each platform operates in its own attribution silo. When the same user sees a Meta ad on Monday and a Google Shopping ad on Wednesday before converting on Thursday, both platforms claim full credit.
At high spend, this becomes systematic. Attributed revenue accumulates duplicate counts at an accelerating rate, while true incremental contribution grows more slowly. The multiplier compresses. This isn't a platform error — it's a structural consequence of how audiences work at scale.
Elasticity quantifies it
We fitted a power function to each channel: Attributed Revenue = a × Spend^b. The exponent b is the elasticity of attribution with respect to spend.
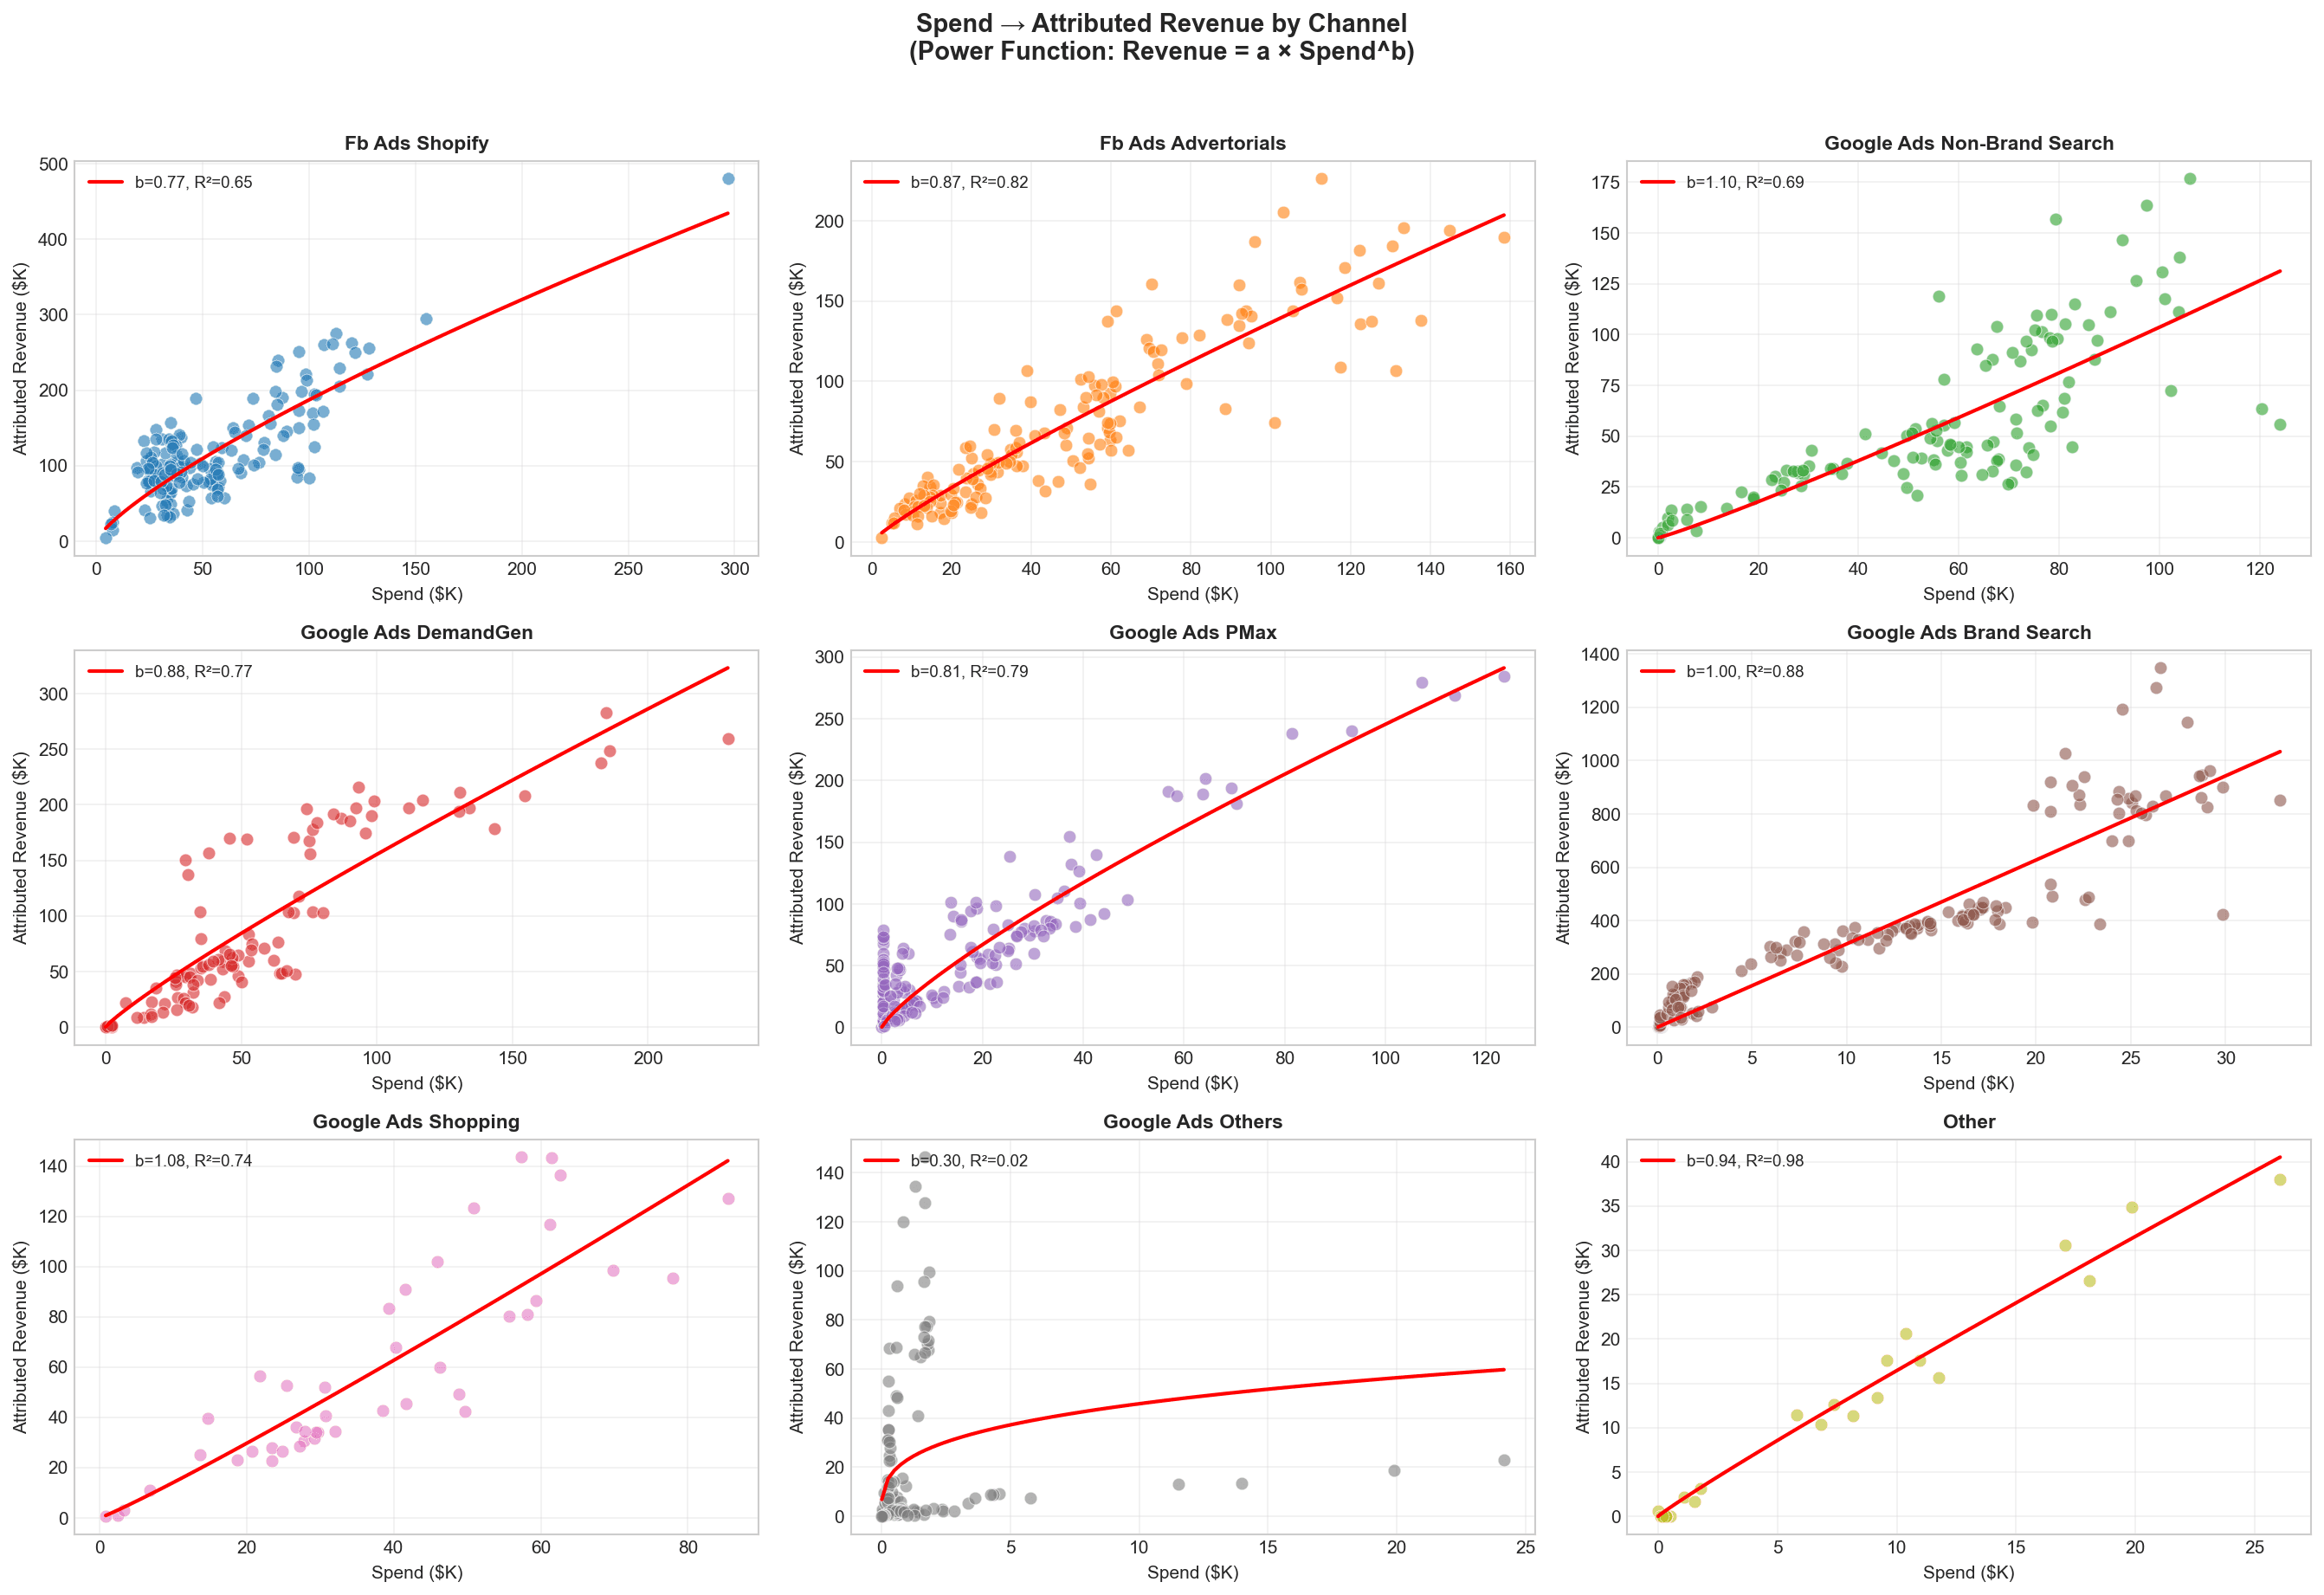
Channel | Elasticity (b) | Interpretation |
|---|---|---|
Google Non-Brand Search | 1.10 | Increasing returns — scaling headroom |
Google Shopping | 1.08 | Near-linear — healthy scaling |
Google Brand Search | 1.00 | Linear — but massively inflated baseline |
Google DemandGen | 0.88 | Mild diminishing returns |
Facebook Advertorials | 0.87 | Mild diminishing returns |
Google PMax | 0.81 | Diminishing returns |
Facebook Shopify | 0.77 | Strong diminishing returns — approaching saturation |
Any channel below b = 1.0 is in diminishing returns territory. Because incremental revenue saturates faster than attributed revenue, the multiplier shrinks as spend grows.
The Evidence: What a Fixed Multiplier Gets Wrong
Channel | Attributed ROAS | Incremental ROI | Multiplier | What's Driving Inflation |
|---|---|---|---|---|
Google Brand Search | 32.5x | 1.6x | 0.05x | Captures organic demand that converts anyway |
Facebook Shopify | 2.1x | 0.6x | 0.29x | Heavy cross-channel audience duplication |
Facebook Advertorials | 1.45x | 1.14x | 0.79x | Modest inflation |
Google DemandGen | 1.50x | 1.69x | 1.13x | Undervalued — attribution misses upper-funnel contribution |
Google Shopping | 1.57x | 2.04x | 1.30x | Undervalued — strong true incrementality |
The multiplier varies by 26x across channels. Applying a single blended number is using one weather forecast for five cities. But the deeper problem is that each channel's multiplier changes with spend level.
The Automated Fix: Attribution vs. True Incremental ROAS, Updated Daily
The spend-dependent multiplier is more accurate, but only useful if it is recomputed as spend changes. Running this analysis manually means recalibrating once a month at best, which leaves you applying last month's curve to this week's allocation decisions. Every budget shift moves you to a different point on the saturation curve. The multiplier that was right at $50K/week is wrong at $150K/week. And spend changes constantly.
The Performance Incrementality Dashboard automates this calibration. It aggregates your MTA data, MMM outputs, and incrementality test results into a single view, comparing attribution ROAS against true incremental ROAS at campaign level, recalculated daily as your spend shifts. No spreadsheet. No manual model refresh. No stale multiplier applied to live decisions.
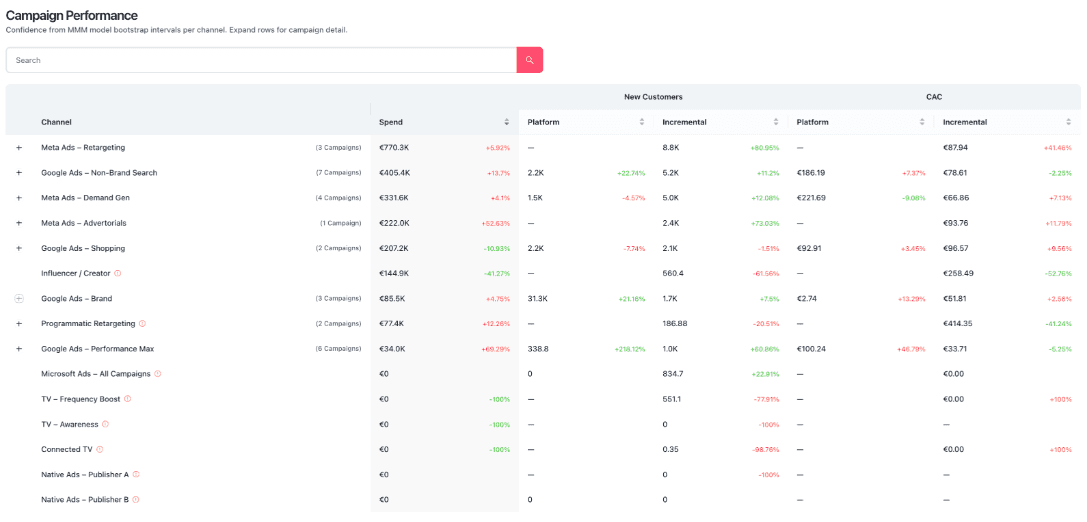
See the Performance Incrementality Dashboard →
Build It Yourself: Replacing Conversion Lift Calibration with a Spend-Dependent Model
For teams building this in-house: here is every step. No black box, no proprietary inputs. Only your MMM outputs and daily attribution data from Google and Meta. The methodology below replaces the fixed multiplier with a spend-dependent function you can run in Excel or Python. The trade-off is operational: the right answer requires rerunning the analysis every time spend shifts meaningfully. If that overhead is the bottleneck rather than the methodology, skip to the dashboard above.
About This Analysis
Data inputs: 155 weeks of weekly MMM outputs (Oct 2023 – Apr 2026) for a European DTC brand; weekly campaign data from Google Ads and Meta Ads Manager; channel mapping tags. Validation: campaign-level incremental sums matched MMM channel totals within 0.01% for every week in the dataset.
Step 1: Source Channel-Level Weekly Incrementality
You need a Marketing Mix Model — the only methodology that isolates true causal contribution at channel level, controlling for organic baseline, seasonality, and cross-channel effects. Open-source options: Meridian (Google), Robyn (Meta), PyMC-Marketing. Minimum: 12–18 months of weekly or daily data.
(Always consider to calibrate the MMM using incrementality test results as it will reduce the risk of the MMM to be wrong in estimating the true iROI)
Step 2: Build Your Spend → Attribution Curve
For each channel, fit: Attributed_Revenue = a × Spend^b. R² > 0.65 is acceptable; R² > 0.80 is strong. This is your attribution response function — at spend level S, what attributed revenue should I expect?
Step 3: Build Your Spend → Incrementality Curve
Same approach: Incremental_Revenue = c × Spend^d. Use MMM-sourced values. For most channels, d < b — incremental revenue saturates faster than attributed revenue. The gap between b and d is the audience overlap effect made quantitative.
Step 4: Derive the Spend-Dependent Multiplier
Since d < b, the exponent is negative. The multiplier declines as spend grows. A fixed multiplier is a horizontal line through this declining curve — accurate at one spend level, wrong everywhere else.
Step 5: Apply It Daily
Practical notes: Use a 7-day rolling average spend (not raw daily — too noisy). Apply per channel, never blended. Brand Search and Facebook Shopify differ by 26x. Keep brand and non-brand separate. When spend changes >30% week-over-week, re-check your position on the curve.
Step 6: Recalibrate Quarterly
Curves shift with creative refreshes, new channels, and competitive changes. Re-fit the power functions every quarter using updated MMM outputs. The curve shape is usually stable; the absolute levels shift. Annual recalibration is not enough.
Common Mistakes to Avoid
One multiplier for all channels. Brand Search and Facebook Shopify differ by 26x. A blended number is meaningless.
Ignoring spend level changes. The multiplier valid at $50K/week is wrong at $150K/week.
Applying last year's number. Overlap dynamics evolve with new channels, competitor budgets, and algorithm changes.
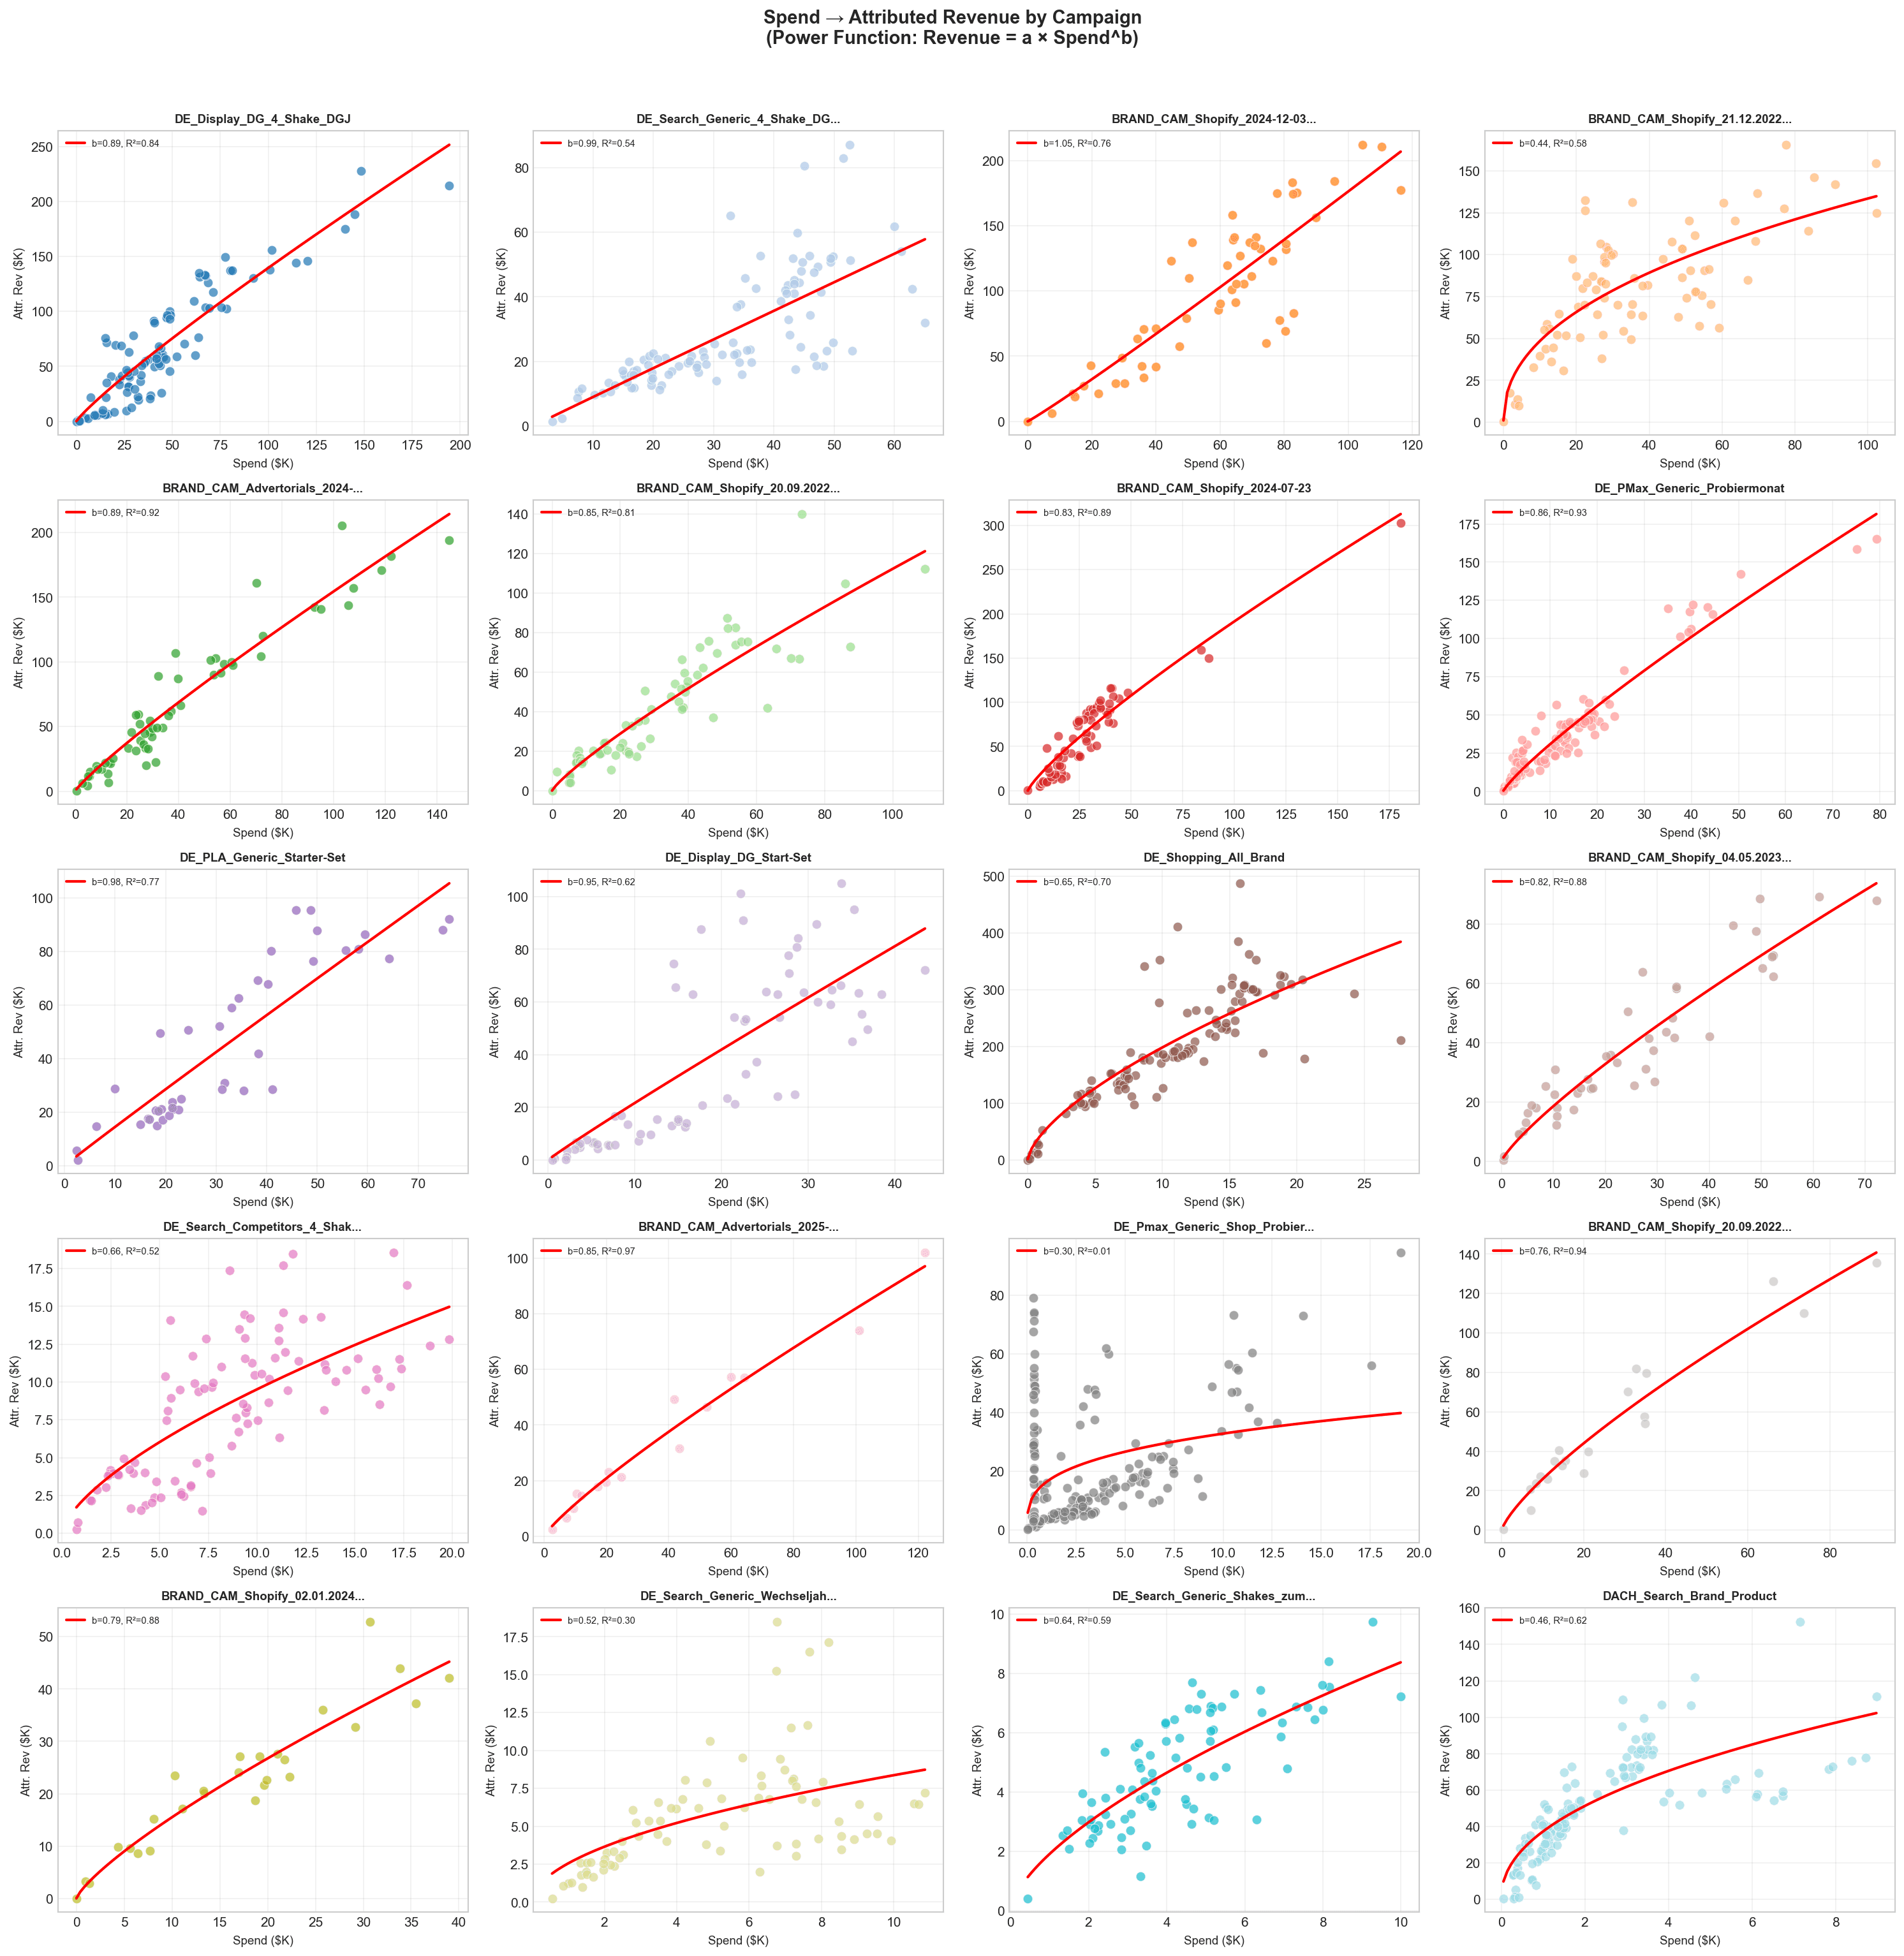
Confusing channel-level and campaign-level. MMM measures channels. Distributing to campaigns requires a ROAS-weighted step — don't skip it.
Ignoring seasonality. Q4 multipliers are structurally different from Q1. Audience pools expand in peak demand; overlap dynamics shift.
Summary
The incrementality multiplier is not a bad idea. It's a useful approximation at one point in time, at one spend level, for one channel.
It breaks whenever any of those conditions change. And in marketing, they always change.
The fix isn't complex. Preserve the response curve instead of collapsing it into a constant. Fit a power function for attribution. Fit one for incrementality. Compute the spend-dependent ratio. Apply it with current spend as the input.
The payoff: +18% incremental revenue from the same budget. Not from new spend — from understanding where you actually sit on the saturation curve.
The multiplier gave you a shortcut. This gives you the right answer.
Analysis based on 155 weeks of campaign attribution and MMM data for a European DTC brand (October 2023 – April 2026). All channel and brand names anonymized. Methodology validated against MMM channel totals with <0.01% weekly deviation.
References: Meta Calibration Methodology · Google Incrementality Testing · Think with Google · Lifesight: Incrementality-adjusted Attribution